|
GMTB Common Community Physics Package (CCPP) Scientific Documentation
Version 1.0
|


|
|
GMTB Common Community Physics Package (CCPP) Scientific Documentation
Version 1.0
|
|

It is the surface roughness length calculation based on the surface sublayer scheme from [87]. GFS Noah LSM Model are largely responsible for the quality of model forecasts produced for near-surface weather parameters, such as 2-meter air temperature ( T_{2m}) and surface skin temperature ( LST). LST is derived from the surface energy budget, and is particularly important to remote sensing and data assimilation. How precise these two parameters can be simulated by the model strongly depends on how accurate the surface heat fluxes are parameterized, particularly the surface sensible heat flux ( SH). The surface thermal roughness length is a key parameter to determine SH. Previous GFS version do not distinguish between the roughness length for heat and momentum. The aerodynamic roughness Z_{0m} is used for wind, while the thermal roughness Z_{0t} is used for heat and water vapor. In general, Z_{0m} is different from Z_{0t}, because the transfer of momentum is affected by pressure fluctuations in the turbulent waves behind the roughness elements, while for heat and water vapor transfer no such dynamical mechanism exists. [87] found that the surface skin temperature can be at least 10 K higher when considering the surface sublayer (or the variable ratio of the Z_{0m}/Z_{0t} ) than without in the desert summer afternoon. In May 2011, the new vegetation-dependent formulations of thermal roughness formulation ([91]; [92] ) was implemented to deal with the cold LST bias over the arid western continental United States (CONUS) during daytime. This LST bias contributes to large errors in simulated satellite brightness temperatures over land by the Community Radiative Transfer Model (CRTM) and hence the rejection of satellite data in the NCEP Gridpoint Statistical Interpolation (GSI) system, especially for surface-sensitive satellite channels.
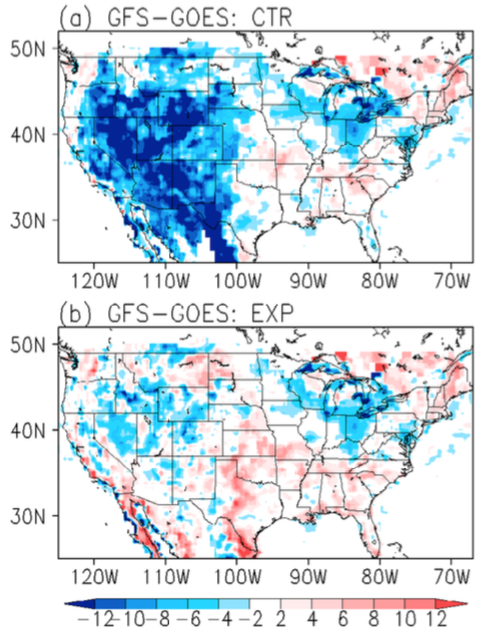
Figure 1 show the 3 day average land surface skin temperature predicted by the GFS and comparison with the GOES-derived satellite measurements. At 18:00 UTC (midday in local time over the central United States) in the control run (Figure 1a), a substantial cold bias can be found over the west half of CONUS (i.e., arid or semiarid regions). The new roughness length formulations significantly reduce the cold bias in the western CONUS, while the LST in the eastern CONUS, where the bias is small in the control run, is not much affected.
 1.8.11