Activities Report
1 March 2012
The Ensembles Team has worked to complete the activities in the DTC Annual Operating Plan (AOP) 2011 while at the same time working towards the coming activities in AOP 2012. In this document, we detail the efforts toward the objectives defined in the 2011 AOP Plan (as listed in the document www.dtcenter.org/DTC-AOP-2011-final.pdf), plus describe additional work. Here we also comment on work towards a functionally equivalent environment, a replica of the NCEP Short-Range Ensemble Forecast (SREF system for use by DTC in testing and evaluation.
4.4.1 Overall Design
Ensemble Portal
Part of the process of testing the initial perturbation technique, and other steps of the Ensemble System, is to install and run the Ensemble Portal a graphical user interface on the supercomputers capable of running ensemble systems. (The Ensemble Portal is an extension of the WRF Portal wrfportal.org/WRFPortal.html created at NOAA/ESRL/GSD).
Development of the Ensemble Portal has come a long way this year. DTC has added a major new feature to both the Ensemble Portal and to the Workflow Manager (WFM or Workflow)—the ability to run NWP forecast ensembles. A Workflow script can now specify multiple ensemble members, each with its own set of namelist variables (namelist.wps and namelist.input), each with its own set of environment variables. When the WFM is launched using the Ensemble Portal, a separate Workflow script (including an associated namelists and system environment variables) for each ensemble member.
The ensemble feature greatly simplifies running an ensemble. For example, a user can simply specify a different physics option for each ensemble member and the WFM will subsequently launch the appropriate runs, see figure 1. The progress of the ensemble member runs can be monitored in real time within an Ensemble Portal window, see figure 2.
In September, DTC worked to get the Workflow software ported from the ESRL supercomputer Jet to the Texas Advanced Computing Center’s Ranger, which involved system support additions and software modifications (to the Portal and with configuring Workflow). The Ensemble Portal's ‘system-to-system copy’ feature now makes configurations identical among platforms and is a straightforward process.
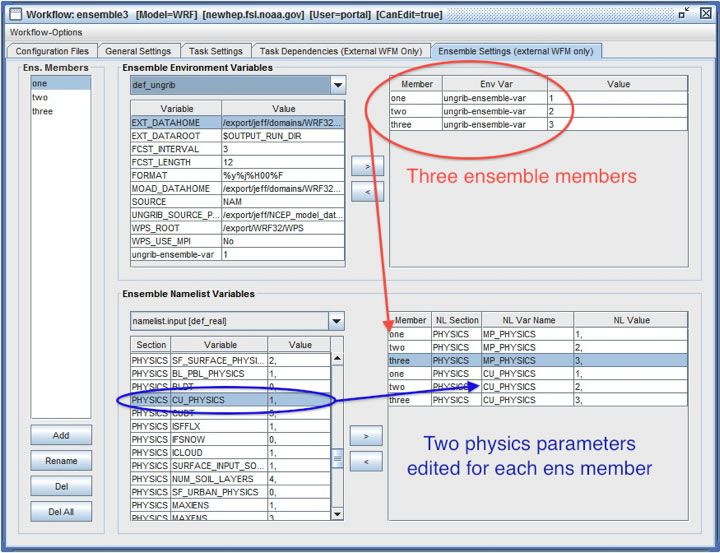
Figure 1. A screenshot of the ‘Ensemble Portal’ showing, first, the creation of three ensemble members and second, the showing how to interactive modifications made are made to the physics options of WRF to create the differences between ensemble members. Output from Ensemble Portal is written to WFM scripts.
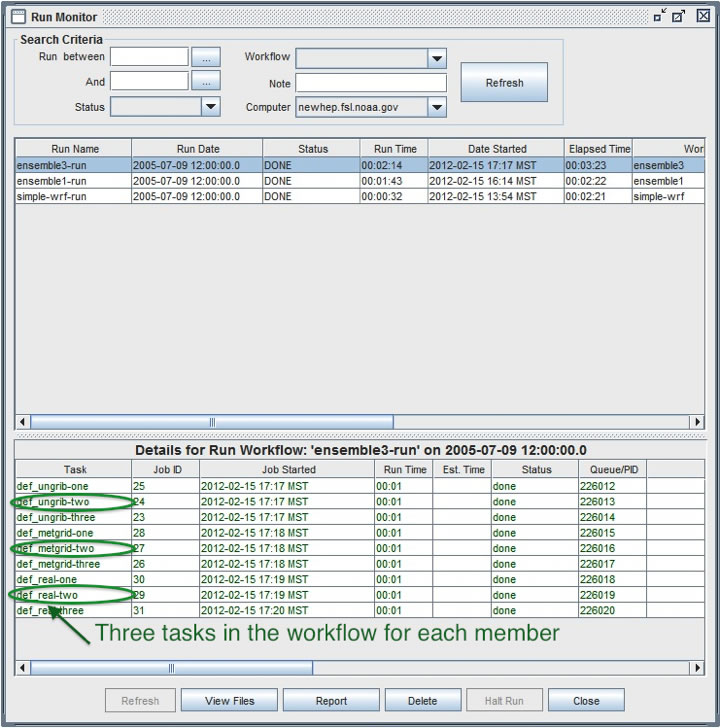
Figure 2. The Ensemble Portal showing status of Workflow Manager as it runs and manages system processes using scripts. Here, three different ensembles tasks have been completed for ensemble members one, two and three.
With the use of the Ensemble Portal GUI functionality, all of the numerous ‘non-cycling’ runs have been completed. For the Initial Perturbation experiments, a simple 6-member ARW ensemble has been run. Each ARW member was configured in the same way: the only difference is the model initial and boundary conditions. For the experiment, each ensemble member is driven by one of the GFS ensemble members. The next step will be to run the same 6-member ensemble with cycling and compare results.
Running ensembles configurations on a variety of systems can become complicated rather quickly. A feature of the Ensemble Portal that helps a user get a handle on all the combinations of choices and systems is a ‘Job Screen’ also known as a Report Screen where a software stack, architecture information, user information, etc. are available on as a summary report, figure 3.
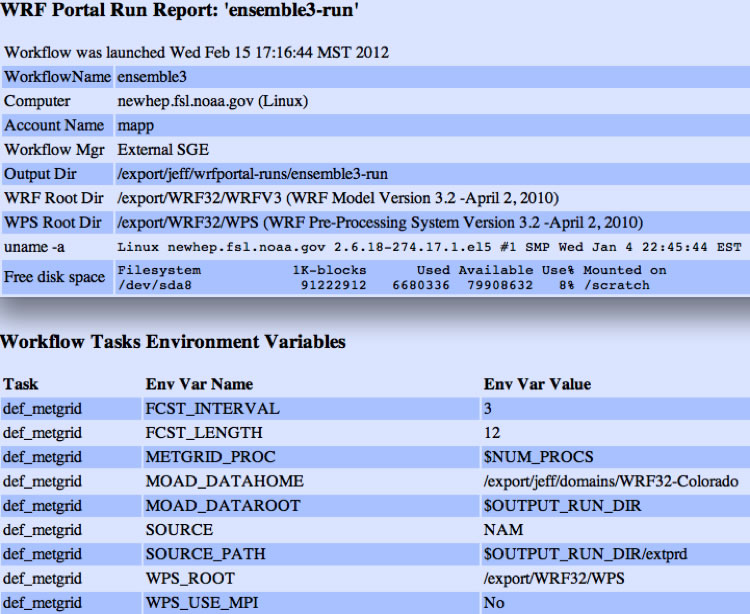
Figure 3. Ensemble Portal Job Screen, a comprehensive HTML report
DET Ensemble Code Repository
Acquisition of ensemble and ensemble post-processing software from various organizations prompted discussion meetings, planning and a subsequent decision on software management and revision control for DET software. After careful evaluation, the design approach for managing DET software was patterned after the code management used by both DTC Gridpoint Statistical Interpolation (GSI and DTC Hurricane Weather Research and Forecast system (HWRF).
An Ensemble Task Code Management Plan has been prepared with the following goals:
- Provide current operational SREF capabilities to the research community;
- Provide a pathway for ensemble research to operations;
- Facilitate transfer of code between EMC and DTC; and,
- Install safeguards to protect integrity of the code.
While a detailed code management plan is in place, the specific mechanics of maintaining the cross-repository version control of the DTC and EMC ensemble repositories required additional planning. The DET/DTC/EMC repository cross- management concept has been developed and already positively accepted in NEMS/Global, NEMS/Construct and NEMS/mesoscale groups of EMC. Figure 4 gives a schematic of how the EMC and DTC repositories will maintain consistency DTC has initiated cross-repository code management concept as well as ongoing activities of the code management plan composition and the establishing of NCEP libraries NCEP/DTC collaborative development mechanism.
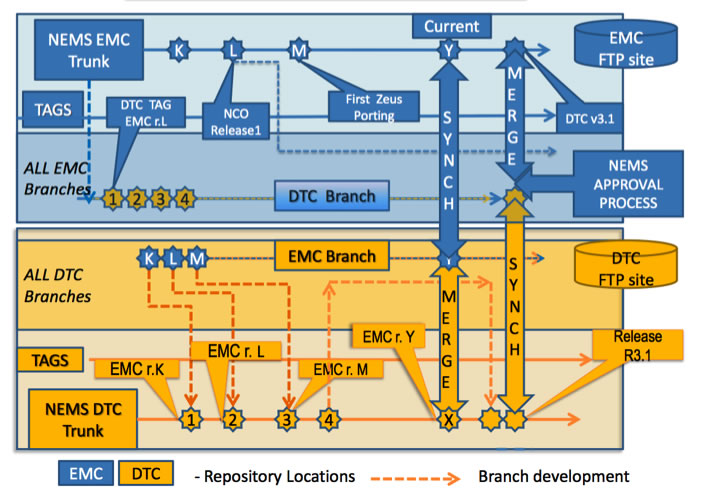
Figure 4. An image of the cross-repository revision control concept, showing a working NEMS/SREF DTC/DET-EMC repository.
4.4.2 Ensemble Configuration
The initial pull of the NCEP SREF (v6.0.0) code and scripts from the NCEP repository to the DTC code repository is underway and nearly complete. The process was stopped when it was realized that a number of binary and data files were included in the first NCEP EMC SREF repository, and that those larger files would reside in a mass storage environment at DTC, not the code repository itself.
When completed, DTC will have the entire SREF system as shown in figure 5, including the creating of initial perturbations, the model physics perturbations (influenced by the work of the Mesoscale Modeling team, section X.X), statistical post processing (including downscaling and bias correction work mentioned in this section), product generation, and verification.
For AOP 2012, the DTC plans to establish a basic capability for the ensemble configuration module. Building on the experience with the Portal, during AOP 2011, the DTC will incorporate the capability of running various models within the NEMS and WRF frameworks into the Ensemble infrastructure. This work will lead to a functionally equivalent environment (FEE) to the NCEP SREF.
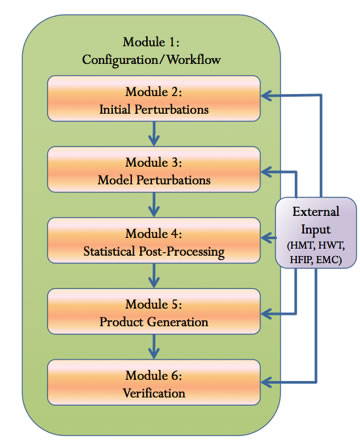
Figure 5. The modular structure of the components of an ensemble system envisioned by the DTC Ensemble Team.
Functionally Equivalent Environment
The term Functionally Equivalent Environment (FEE) is a replication of SREF (North American Ensemble) at DTC. The move to develop and maintain an Ensembles team code repository containing (among other things) the entire NCEP SREF has led to the ability to do testing and evaluation of that system. In order for that testing and evaluation to have maximal impact, it needs to be done in an environment as close to the operational environment as possible. Furthermore, if tests of new community developments are run in such an environment, their transition back to operations is easier than if those tests are not done in such an environment.
This work has been focused on the definition and forming foundation for the DTC computing environments (FEE and Functionally Similar Environment (FSE)) as well with several components of those environments. Such as:
- Definition of the FEE/FSE of the ensemble workflow and SREF workflow merging concept.
- Prototyping of HPC-module-based FEE/FSE on Vapor (EMC’s research IBM machine).
- Isolating of the NCEP libraries and data associated with the NMMB model and providing them for DTC.
- Definition of the common and exchangeable components of the similar computational environment.
- Porting of the forecast components of the future DTC computing environments: the NMMB-model of NEMS on Jet/Linux platform.
- Test examples and perform NMMB regression tests on Jet with a comparison of the baselines from different releases based on the analysis of the temperature and precipitation fields.
- Establishing a foundation for cross-repository based development. Coordination between organizations (EMC and DTC) and elaboration on the code management plan.
- Initiating the integration of NCEP developed third party managed libraries, as a part of FEE/FES activities.
During the AOP 2011, as a collaboration of EMC and DTC, the workflows of EMC, the NMMB related workflow as well as ensemble workflow scripts have been formalized and mutually accepted as shown on the flowcharts in figures 1 and 2. A module based FEE/FSE prototype has been created on Vapor (NCEP’s research IBM) and currently is moving onto the new NOAA research computer Zeus. NMMB associated libraries and data have been isolated, parameterized and provided at DTC project space on the NOAA/ESRL supercomputer Jet. A number of the NMMB revisions have been successfully ported on Jet, which at the time was the DTC environment of choice. These revisions all passed 48 hour forecast, global version of NMMB, regression tests. With Jet having being taken off line for DTC (and other users) in August, this development will be migrating to the new NOAA research computers Zeus and Gaea.
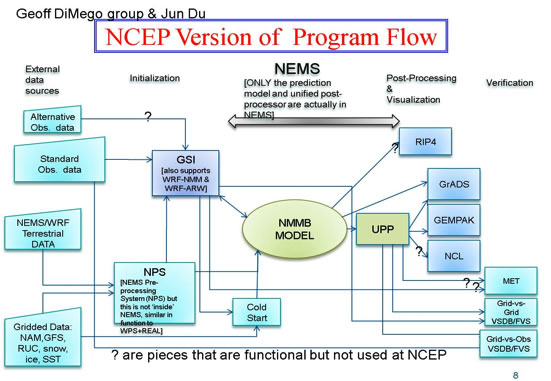
Figure 6. Current NCEP NMMB-based DTC workflow convention.
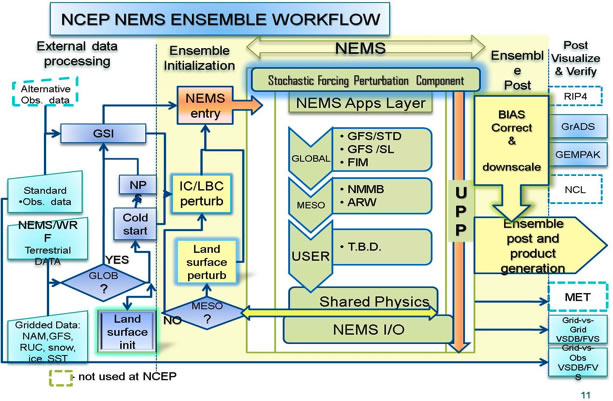
Figure 7: Eugene Mirvis: NEMS based workflow to be merged to DET FEE/FSE)-based on collaboration with NEMS, MMB and SREF of EMC/NCEP.
The latest flowchart is considered as a roadmap for the design of testbed’s similar computing environment.
The main goal and all objectives on this phase have been achieved, regarding FEE/FSE structuring, definition and code porting. Also a number of the experiments have been conducted for every ported revision.
One of the first tests is a case with baseline data and scheduler scripts for producing a 48-hour global NMMB model forecast on Jet, with a potential of 3 min time step of simulation to be visualized. Comparisons of results between revisions, figures 8 and 9, show that in spite of an assumption of inheritance in regression tests (that the results should be identical), these tests demonstrated some differences among ported revisions within the same experiments. The reason for these differences is not yet known. It is unlikely that there were changes to model physics during the time period of code development, and so future research on some particular compilers and architectures as possible reasons for the differences is to be researched.
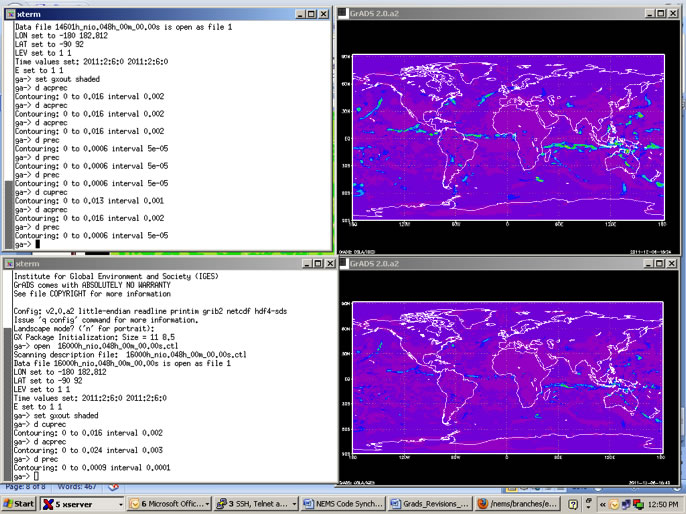
Figure 8. JET–ported NEMS/NMMB Revision comparison of 48hr forecasts of precipitation. Of note are the significant differences in precipitation near the equator.
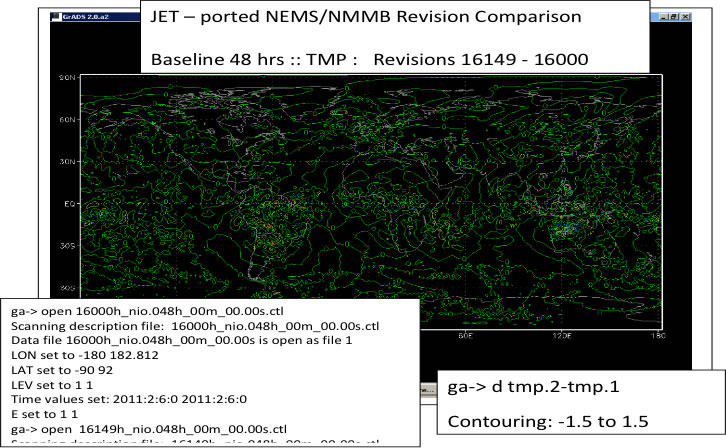
Figure 9. Image shows the difference in the baseline of NMMB 48hr forecasts of temperature between two Jet-ported code revisions. Of significance is that the temperature values are not zero.
While these differences highlight the need for further testing, it is possible that an EMC FEE ”butterfly test”, for consistency with a described outcome. However, taking into account future Jet availability for this project we may have to address to that issue in future architectures (as Zeus, Gaea and Yellowstone)
4.4.3 Initial Perturbations
Report on vertical variation of rescaling initial perturbation technique testing
Within the many components of the NCEP SREF system is code that ingests the 6-hour forecasts of an SREF run and rescales them to produce perturbations for the initial conditions of the next NCEP SREF set of forecasts. As of summer 2010, this code calculated the difference between one pair of perturbations (perturbations n1 and p1) for 850mb temperature, and then divided the computed value by 0.7 (the expected climatological mean value) to compute a rescaling factor. This factor was applied to all variables at all levels. It is possible that this factor could be varied spatially. As a first attempt at estimating spatial variation, the DTC conducted a set of tests to calculate the ratio of ensemble spread to ensemble mean forecast error at four vertical levels: 250, 500, 700, and 850 hPa. From these estimates, the code of summer 2010 was modified to have a vertically varying rescaling factor. In the NCEP SREF data on hand at NOAA/ESRL, there was only one field in NOAA/ESRL SREF data sets that could be used for investigation of vertical variation: geopotential height. The MADIS radiosonde data was used as truth, with height being the variable of choice.
The first assessment that was made was calculating the MAE and RMSE of the ensemble mean of the 3-hour forecasts of 850 hPa temperature. This calculation was done to test the validity of the initial assumption. The value was calculated for the mean of all 21 SREF ensemble members as well as for the 10 ARW and NMM members of the SREF 2010/2011 version.
Ensemble Months Cases 850hPa MAE 850 hPa RMSE
ALL (21) June/July 2011 10535 0.787 1.092
ARW+NMM(10) June/July 2011 10535 0.837 1.157
ALL (21) Nov/Dec 2010 9040 1.036 1.411
ARW+NMM(10) Nov/Dec 2010 9040 1.103 1.500
From this evaluation, it is clear that the error of the ensemble mean of the full SREF and the 10 ARW/NMM members for 3-hour forecasts is greater than 0.7, and thus, during the first 3-hours the errors grew as expected.
For the formal comparison, the ratio of ensemble spread to mean absolute error, for height forecasts, for the 250, 500, 700, and 850 hPa levels were computed. Results for winter months (November/December 2010) indicate that the spread of the full 21 member NCEP SREF is too high at lower levels (ratios of 1.119 and 1.179), and close to 1 at higher levels (See figure 10).
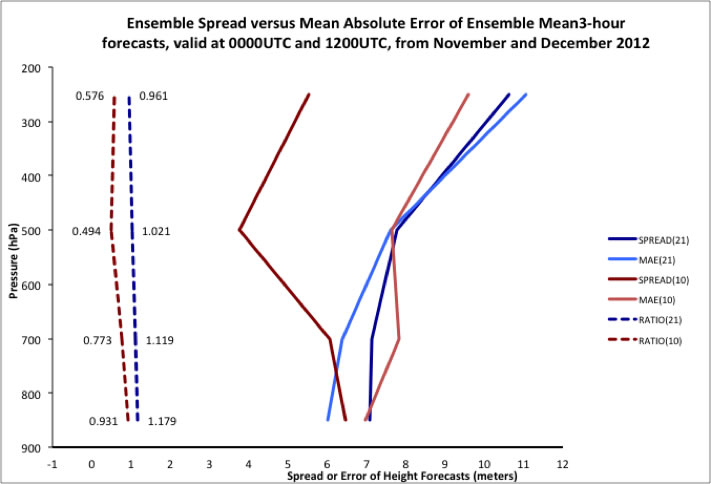
Figure 10. Ensemble mean error versus ensemble spread, showing that ensemble spread is in general greater than ensemble mean forecast error – the exception being at high altitudes.
A comparison of the spread/skill ratios, normalized to the 500 hPa ratio, at the four levels gives the following results:
LEVEL WINTER SUMMER AVERAGE
250hPa 0.941 1.040 0.991
500hPa 1.000 1.000 1.000
700hPa 1.096 1.071 1.083
850hPa 1.154 1.081 1.117
The DTC testing suggested that the present method of computing initial perturbations is likely fine as is from 500 hPa to the top of the atmosphere. The DTC suggests that from 500 hPa to the surface, that the values of initial spread be decreased, that the value falls to 12% less than the 500 hPa at the 850 hPa surface.
DTC delivered modified code to NCEP/EMC, for possible future use. It is intended that a simple switch from one version to the other would result in initial perturbations that are smaller closer to the surface, and thus, result in smaller ensemble spread at 700 and 850 hPa than otherwise would be the case.
4.4.4 Ensemble Products
HWT Ensemble Product Evaluation
The NOAA Hazardous Weather Testbed (HWT) Experimental Forecast Program (EFP) has conducted Spring Experiments (SEs) since 2000. The DTC collaboration continued in 2011, with the goal of evaluation of available storm-scale ensembles to formulate recommendations to NCEP on the next-generation storm-scale ensemble systems. The collaboration was performed through the DTC Ensembles Task and had a secondary goal of obtaining promising product algorithms from participating organizations to serve as the foundation for the DTC Ensemble Testbed (DET) products and services module. The HWT SE 2011 took place from May 9 to June 10, 2011. NOAA’s Hydrometeorological Predication Center (HPC) participated for the second year to continue evaluating how the NCEP Environmental Modeling Center (EMCexperimental models compared to the Center for Analysis and Prediction of Storms (CAPS) Storm-Scale Ensemble Forecast (SSEF) system. The goals agreed upon during a September 2010 planning meeting for SE 2011 were modified to accommodate changes in the DTC organization and goals for NOAA Testbed Collaborations. The final goals for the DTC collaboration with HWT SE 2011 include:
- Evaluate two variables, Composite Reflectivity and Accumulated Precipitation, for entire CAPS storm-scale ensemble and NCEP/EMC contributed models in near-real-time.
- Identify promising ensemble and product post-processing techniques for inclusion in the DTC Ensemble Task.
- Obtain product algorithms and use as a foundation for the DTC Ensemble Task post-processing module.
- Write a report detailing DTC findings and recommendations.
Most of the activity during this period was focused on analysis and reporting through presentations and report writing. Strides were also made in obtaining product algorithms from participating organizations. Specific milestones include:
- Presented HWT-EFP 2011 Spring Experiment results at 21st Statistics and Probability Conference at the 92nd Annual AMS Conference in January.
- Presented HWT-EFP 2010 Spring Experiment results at the 3rd Aviation, Range, and Aerospace Meteorology Special Symposium at the 92nd Annual AMS Conference in January.
- Completed a report on findings from the evaluation of aviation related variables included in the HWT-EFP 2010 Spring Experiment.
- Developed an outline and performing analysis for a report of findings from HWT-EFP 2011 Spring Experiment.
- Obtained products code from NCEP/EMC for SREF system, from AFWA for the Mesoscale Ensemble Prediction System (MEPS), and from CAPS for the SSEF system.
- Completed running a test case using CAPS SSEF products code.
- Inventoried products' code for possible inclusion in the repository.
Figure 11 and 12 provide examples of the analysis performed during this performance period. In figure 11, CAPS experimental system products tend to have higher median values of Area Under the Curve (AUC) for the homogeneous sample of 15. AUC provides the forecaster with a sense of the ensembles ability to discriminate between event (accumulated precipitation exceeding 12.7mm) and non-event. SREF median AUC is always above the no-skill line of 0.5. Optimal skill is 1; no skill is less than 0.5. Black bars in boxes indicate median values of samples, and the notches indicate 95% confidence intervals about the median. When base rates are higher, indicating more convective activity in the moving Daily domain (at 06, 12, 24, and 30 hour lead times (not shown here)), the SSEO has higher median values than during the overnight hours (leads of 18-24hr) when convection is sparse. In figure 12, CAPS and SSEO are experimental models and appear to show potentially greater skill at higher probabilities over SREF, which is the operational baseline. CAPS ensemble probabilities post-processed using a neighborhood smoothing approach results in the most optimal reliability of all four forecasts. The sample size precludes drawing inferences of statistical significance; it may also be driving some of the over-forecasting errors seen within SREF and CAPS probabilities. Further investigation is warranted.
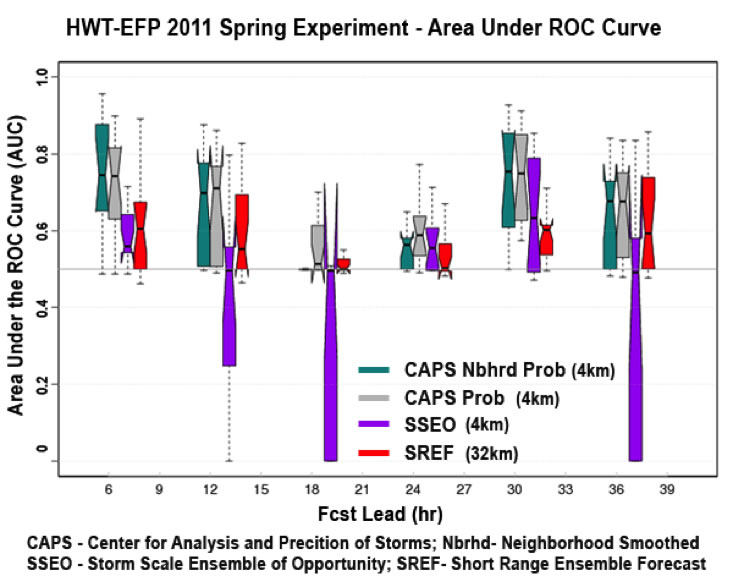
Figure 11. Box and whisker plots of Area Under the Receiver Operating Characteristic (ROC) Curve aggregated over 15 homogeneous samples from three ensemble systems evaluated during the HWT-EFP (Experimental Forecast Program) 2011 Spring Experiment. Forecasted probabilities are for 6-hr accumulated precipitation exceeding 12.7mm.
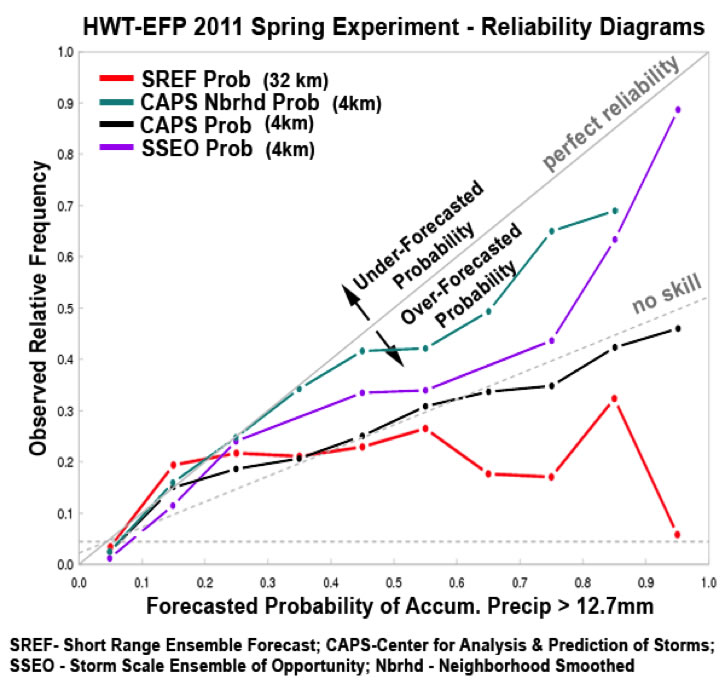
Figure 12. Reliability Diagram aggregated over all lead-times for three ensemble systems evaluated during the HWT-EFP (Experimental Forecast Program) 2011 Spring Experiment (homogeneous sample size of 15). Forecasted probabilities are for 6-hr accumulated precipitation exceeding 12.7mm. Lines that lie close to perfect reliability curve indicate optimal skill.
Product Algorithms
With the goal of creating a suite of community ensemble product algorithms, the DET team contacted each of the following three organizations: NCEP, AFWA and Oklahoma University Center for Analysis and Prediction of Storms (OU CAPS). The DET team was able to get a copy of the current ensemble and ensemble post-processing system from each organization. These systems have a variety of post-processing product algorithms and software approaches used in the community, which will be of great value to DTC ensemble testing. The team was gratified by the positive response of of all who were asked to contribute, as they saw the value in their contribution of systems for the DET.
The software first to be evaluated by DET was the system from OU CAPS.The OU CAPS system was run operationally in 2011 on a super computer system of the National Institute for Computational Science (NICS) at the University of Tennessee, Knoxville called Kraken. With limited resources available for the task of porting and running this ARPS ensemble system, it was proposed that we use the same system architecture. An allocation was acquired for this work on Kraken by requesting permission to transfer 10K SUs (from the Startup Allocation of 300K SUs) on the NSF Supercomputer at University of Texas at Austin known as Texas Advanced Computing Center (TACC) Ranger to the NSF Supercomputer at University of Tennessee known as National Institute for Computational Sciences (NICS) Kraken system, which was granted.
DTC’s Paula McCaslin worked with Fanyou Kong of OU CAPS to build and run the ARPS ensemble on Kraken. The CAPS Experimental Ensemble Forecast post-processed ensemble products include postage-stamp and spaghetti plots, ensemble mean in the form of Probability Matching, ensemble maximum, ensemble probability, neighborhood probability maps of selected fields, and more. The CAPS post-processed ensemble products were based on a 24-member sub-ensemble of the 50 original members.
Initially, data from a specific date were used: April 27, 2011. The software was challenging to build, but building on the common platform made this somewhat easier. Many prerequisite software libraries are required to build the system executables. Fortunately, the Kraken system is heavily used, which meant that necessary libraries were available. We were able to run the post-processing product generator successfully on a limited set of data for the initial test. An example of a product created by this product generator is shown in figure 13. The code that creates nearest-neighbor probability matching is a candidate to be extracted and ported as a standalone module for use in the DTC with other ensemble systems.
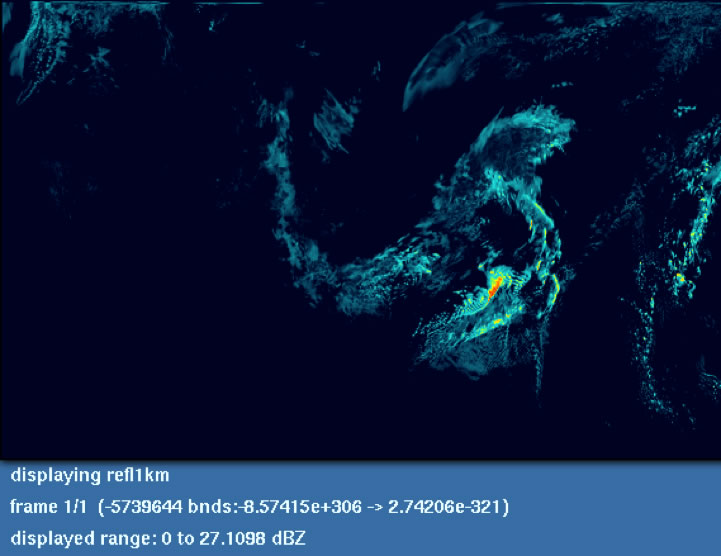
Figure 13: Image of 1km reflectivity ranging from 0 to 27 dBZ at 14hr forecast from CAPS ensemble post-processing run by DTC on Kraken for April 27, 2011 at 14z, a study of the Super Tornado outbreak over the southern states of the US.
4.4.5 Verification
Expanded capability for the verification module
In order to more effectively assess ensemble forecasts and individual ensemble members, several new display tools have been developed by the Verification task. Among these are spread/skill diagrams and so-called ‘performance diagrams’. Examples of performance diagrams and their application are shown in the section titled. For ensembles, their principal advantage is as a diagnostic tool; on such diagrams, several different scores for individual members can be conveniently displayed and visually compared.
Extension of HMT Winter Exercise Verification to Additional Ensemble Forecast Systems
The Hydrometeorological Testbed (HMT) regional research ensemble has served as an initial developmental tool for DET. During two previous HMT winter experiments QPF verification has been the strong focus of the HMT/DTC project. However, for winter 2011-12, verification was extended to other variables and to other ensemble systems. This new verification capability has been principally aimed at background evaluation of several fields important to the NOAA Earth System Research Laboratory (ESRL) Physical Sciences Division (PSD) flux tool installed at several observatories along the Pacific coast. Included in this new set are mandatory and other levels of specific humidity, winds, geopotential height, and temperature, near-surface wind speed and wind components, precipitable water (PW), and wet-bulb freezing level. QPF verification has also continued as in the last exercise, and has been upgraded to provide 3h verification. The system to verify these fields has been designed to provide monthly updates, with the retrospective capability to use METViewer to perform analyses at other periods. An important new addition to the verification model suite is an ensemble of 10 members provided with the very helpful assistance of the Air Force Weather Agency (AFWA). In combination with a newly upgraded SREF, the AFWA ensemble is providing key comparisons with the GSD/HMT ensemble. A preliminary example is the PW comparison of Figure 13, where LAPS analysis from GSD have been employed to verify ensemble means of PW for roughly two weeks of January 2012. (We note that for comparison a parallel verification of PW using point GPS observations in the HMT domain is also being provided, with assistance from the GSD GPS/MET team.) Although preliminary, the analyses on Figure 14 and other results are providing valuable diagnostic information for assessment of the GSD ensemble and other models.
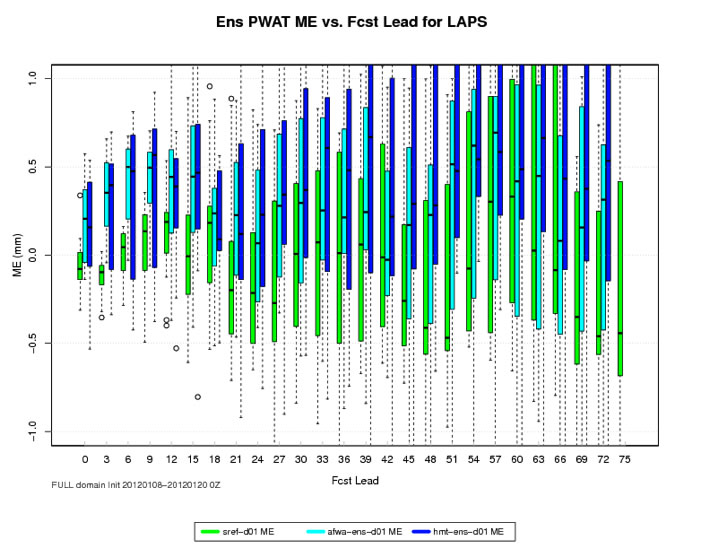
Figure 14. Boxplot display of mean errors (i.e., magnitude bias) during a 12-day period in January 2012 for forecasts of precipitable water in the HMT-West domain by three forecast systems (SREF, AFWA, and the GSD/HMT ensemble). Model forecasts at each lead time were verified using the LAPS analysis for that time. Relatively good performance of the SREF is evident, albeit for a non-stormy period in the HMT domain, and with a particularly strong diurnal cycle.
4.4.6 Computing Resources
Computing resources for the DTC have traditionally been those available to NOAA and NCAR personnel, as well as the research computing (i.e. TeraGrid). For AOP 2011, there was the NOAA Jet supercomputer, as well as the TeraGrid Ranger supercomputer. With AOP 2012 in mind, DTC personnel are now operating on the NOAA Zeus machine, with the NCAR Yellowstone machine coming on line in AOP 2012. The work on the WRF Portal, and the above work on the FEE were both done with a mindset towards allowing numerous community members access to ensemble systems, for their own development and preliminary tests.
4.4.7 Community Interactions
Publication
An introductory article for the Bulletin of the American Meteorological Society (Tollerud et al., 2012) is now in the final review process at BAMS. In it the components of the DET infrastructure are described and the principal objectives are defined. A near-final version accompanies this report as an appendix; when accepted in final form and published, it will be posted on the DTC website.
User Workshop
The 5th Ensemble User workshop was organized by EMC/NCEP and DTC (co-organizer), and took place on May 10-12, 2011, in Laurel, MD. There were over 90 participants, from National Weather Service (NWS) Regional offices (6), NWS Headquarters (17), the National Centers for Environmental Prediction (NCEP) (44), The NOAA Office of Atmospheric Research (OAR, 5), other government agencies (4), private (2), academic (5) & international (11). The main theme of the workshop was “How to support NWS in its transition from single value to probabilistic forecasting”, with the goal being to convey forecast uncertainty in user relevant form. The workshop had 46 presentations, covering all NCEP ensemble forecast systems (SREF, GEFS/NAEFS, Wave ensemble, CFS and NMME). Presentations included reports from NCEP Service Centers and Regions (WFOs), and reports on research and development and verification.
Following the presentations, the workshop participants broke into working groups, with the topics of: Ensemble configurations, Ensemble forecasting, Statistical post processing, Reforecast/hindcast generation, Probabilistic product generation, Forecaster’s role and training, Ensemble data depository / access, and Database interrogation / forecaster tools. A PowerPoint presentation, “Summary and Recommendations from the 5th Ensemble User Workshop”, will be made available on the DTC web site. All presentations from this workshop are available at http://www.dtcenter.org/events/workshops11/det_11/.
4.4.8 Regional GSI-EnKF-Hybrid Data Assimilation
The GSI-Hybrid was not originally an activity for the Ensemble team, but as AOP 2011 progressed, this work was moved into the ensemble team from the Data Assimilation team. Based on our conversations with HFIP management, we are proposing to begin the effort to work with EMC and the community to develop a unified GSI-hybrid system suitable for hurricane applications. As an initial effort, the HFIP HWRF ensemble community was gathered to provide perspective and direction. There were two primary community-building efforts. The first was the development of an HFIP regional ensemble working group; the second was a workshop regarding the GSI-EnKF-Hybrid for HWRF.
The HFIP regional ensemble Working Group has met regularly since its incorporation in September of 2011. In these meetings, there have been a number of presentations on ensemble generation. These conference calls have helped facilitate consensus, and EMC has an HWRF ensemble planned for stream 2 in 2012. (Meeting minutes and past presentations are available at http://rammb.cira.colostate.edu/research/tropical_cyclones/hfip/add_conference_call_summaries.asp )
The HFIP Regional GSI-Hybrid Data Assimilation Workshop, in November 2011, is part of the DTC effort to build a unified GSI-hybrid community system and to help accelerate transitions from research to operations on such a system. Specifically, the purposes of this workshop were to (1) collect information and assess ongoing hybrid related research, (2) facilitate discussion on building a GSI-hybrid framework, and (3) work with HFIP management to focus the HFIP research community on a single regional hybrid system for hurricane forecast operations. The workshop had 40 registered participants.
As the meeting concluded, it was agreed that a unified system will be built based on the current global GSI-hybrid capability currently existent at EMC. Meeting participants supported this unified system. It was decided to set up this unified system within a DTC code repository first, and then talk later about how to build on top of it, allowing community contribution. It was suggested DTC should support not only the system but also scripts for running the system. It was discussed to form a committee of active HWRF GSI-Hybrid developers to organize and coordinate the hybrid effort.
Following this meeting, further discussions took place. Since November, DTC has been active in working to get this system full operational, and ready for real-time evaluation in the coming summer. DTC contributions include, but are not limited to:
- Diagnosis and resolution of bugs in the GSI-Hybrid for HWRF (e.g., the DFI)
- Testing of the needed frequency for partial cycling
- Coordination with the NOAA Atlantic Oceanographic and Meteorological Laboratory (AOML) on satellite radiance bias correction
- Coordination with AOML, EMC, and ESRL/PSD on GSI-Hybrid work
- Development of a code management plan for a DTC EnKF repository
Particular activities that have taken place since that November workshop have been:
- Reviewed GSI-hybrid scripts from NOAA-PSD and NCEP/EMC. Starting to incorporate these into DTC HWRF scripts for GSI-hybrid related testing.
- Reviewed GSI-hybrid code related as part of preparation of following tests.
- Started setting up a case study (2011 TS Bret), testing the GSI-hybrid code components using global ensemble (without EnKF), and using current HWRF operational domains. (Basin scale domain experiments will be done by NCEP/EMC). The purpose of this test is to explore the GSI-hybrid capability before the EnKF component is ready.
- Started collecting configuration and set-up information to test GSI satellite radiance bias correction in basin scale. This work will be base line work for eventually testing satellite radiance bias correction for GSI-EnKF hybrid experiments.
- An initial testing of partial cycling in the current operational HWRF domain, cost shared with other funding, was conducted and has shown big potential to improve hurricane forecasts.