GSI 4D EnVar for Regional Applications

Project Highlights
The goals of this DA T&E activity were to examine the readiness of the GSI Ensemble-Variational (EnVar) system for regional applications and provide an assessment of potential areas for further improvement. The DTC produced a control run based on the NOAA RAP system, which currently uses the GSI 3D hybrid EnVar technique for its atmospheric DA. Then, an experimental end-to-end system, using the GSI 4D hybrid EnVar DA system, was built to investigate the EnVar capability and evaluate its impacts on analyses and forecasts.
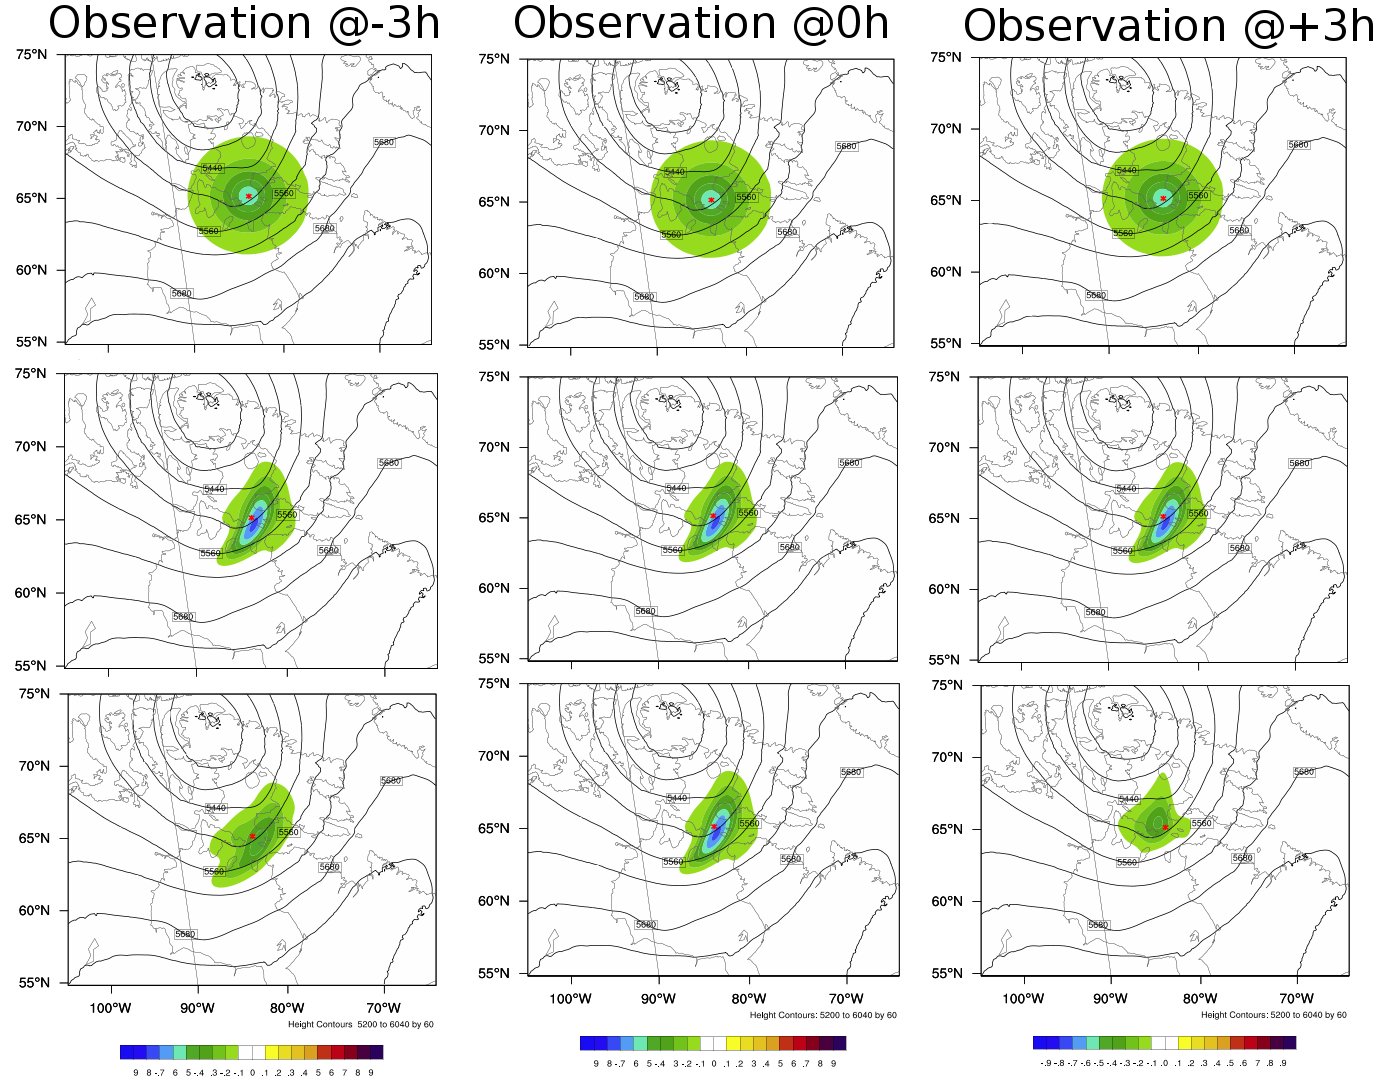
As a first step, the DTC focused on case studies directed at exercising the GSI EnVar system to confirm it was configured properly. This testing phase included performing single observation tests, tuning the observation and ensemble/static error contributions for the hybrid option, and evaluating the merits of using regional ensembles for EnVar instead of using global ensembles (default for the operational RAP system). Figure 1 below shows the temperature analysis increments from the pseudo single observation tests performed using the GSI EnVar system with the 3DVar, 3D hybrid EnVar, and 4D hybrid EnVar techniques, respectively. A single temperature observation was set at -3, 0 and +3 h within a 6-h time window. The results show that the analysis increments of the 4D EnVar experiments vary with the observation time, while the 3DVar and 3D hybrid experiments do not produce time-variant information. Both 3D and 4D EnVar experiments captured the flow-dependent features for the analysis fields due to the incorporation of ensemble-based background errors. These results, which are expected, demonstrated the GSI EnVar system is set up correctly and is ready for further testing. DTC staff also investigated the impact of replacing the 30-km GFS ensemble input (default RAP configuration) with 13- km RAP ensemble input, which reduced the RAP analysis errors, but had minimal impact on the forecasts. Consequently, the DTC decided to use GFS ensembles for its EnVar experiments.

Figure 1 Temperature analysis increments from the pseudo-single observation tests for 3DVar (upper panels), 3D hybrid EnVar (middle panels), and 4D hybrid EnVar (lower panels). One single temperature observation was set at -3h (left column), 0 (middle column) and +3h (right column) within a 6h time window.
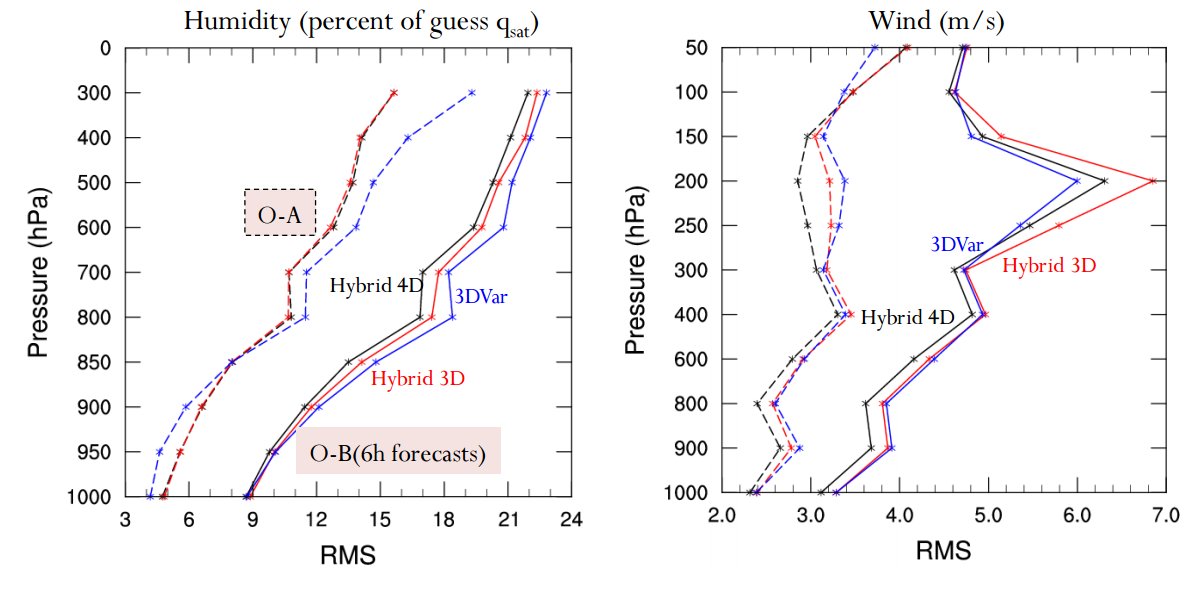
To evaluate the feasibility of applying the 4D EnVar technique to an ARW-based regional system, the DTC ran three EnVar experiments for a two-week period with a simplified RAP framework (e.g., no nonvariational cloudy analysis and digital filter prior to forecasts, 6-h cycling): 3DVar, 3D hybrid EnVar, and 4D hybrid EnVar. All three experiments used the observation files prepared for the GFS DA (e.g. through the quality control (QC) procedures specific for the GFS applications). Figure 2 below shows RMSE of analyses and 6-h forecasts for humidity and wind fields. The 4D hybrid EnVar produced the smallest RMSE for most layers. The 4D experiment also achieved the smallest cost function values, showing improved convergence during the minimization process toward the final analysis. An assessment of the computational costs for these three experiments indicated one 4D hybrid EnVar run requires a 40% increase in computational wall-clock time over a single 3D hybrid EnVar run (using 384 processors on NCAR's Yellowstone computer).

Figure 2 Vertical profiles of the RMSE of humidity (left) and wind (right) analyses (dashed lines) and 6h forecasts (solid) from three experiments: 3DVar (blue), 3D hybrid EnVar (red), and 4D hybrid EnVar (black).
