
HWRF HDFL/HD21 Forecast Comparison

HDFL/HD21 Forecast Comparison Description
- Code
- Models
- Domain
- Cases
- Verification
Codes Employed
The software packages used in the HWRF HDFL/HD21 Forecast Comparison Test were obtained from the HWRF code repository hosted by the Developmental Testbed Center. The versions of all codes have received minor updates since the HWRF v3.4a release in August 2012 but are still very comparable to the HWRF 2012 operational implementation. The revision numbers included:
•WRF - branches/HWRF revision 5957
•WPS - branches/HWRF revision 704
•UPP - branches/HWRF revision 280
•GSI - branches/HWRF revision 947
•HWRF-utilities (atmospheric initialization, miscellaneous libraries and
and tools) - branches/HWRF revision 245
•Princeton Ocean Model for Tropical Cyclones (POM-TC) and
POM-TC initialization - branches/HWRF revision 186 was used for
the HD21 configuration. For the HDFL configuration, code was
altered to restore the momentum, sensible, and latent heat fluxes
to their full values
•NCEP Coupler - branches/HWRF revision 69
•GFDL Vortex Tracker - revision 143
•National Hurricane Center Verification System and scripts for
aggregation of verification statistics and computation of
confidence intervals - revision 37
HWRF Model: HD21 Configuration
Configuration similar to the 2012 operational HWRF.
HWRF Model: HDFL Configuration
Configuration similar to the 2012 operational HWRF but with changes in the POM-TC code to restore momentum, sensible and latent heat fluxes to their full values.
Domain Configuration
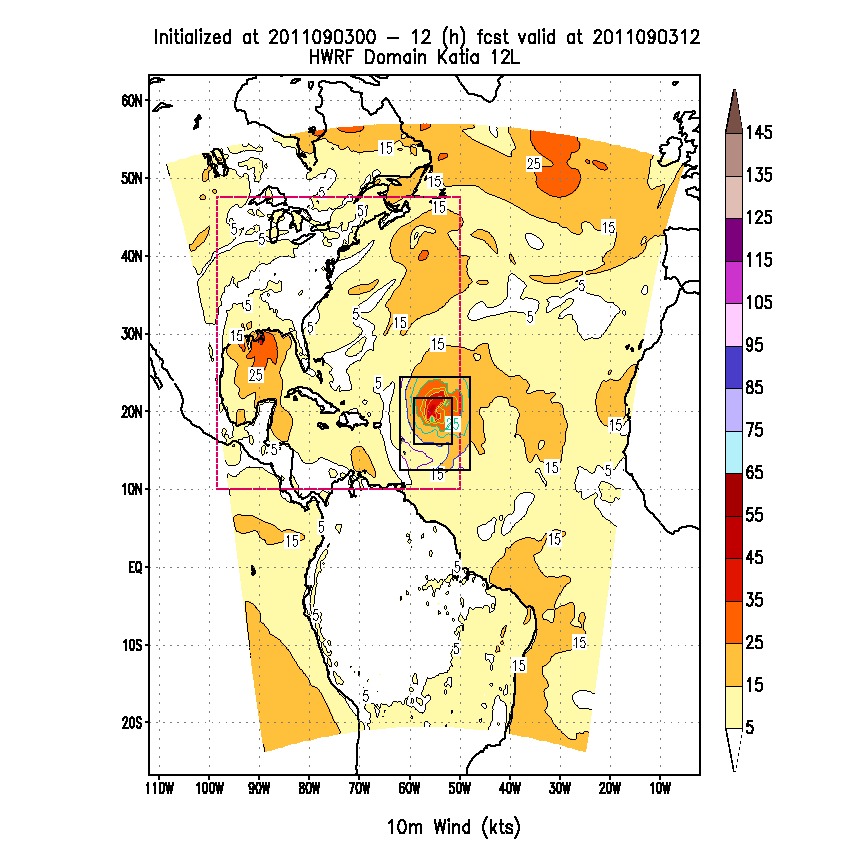
The HWRF domain was configured in a similar way as the 2012 NCEP/EMC operational system. The atmospheric model employed a parent and two movable nested grid. The parent grid covered a 80x80 deg area with approximately 27 km horizontal grid spacing. There were a total of 216 x 432 grid points in the parent grid. The d02 domain covered a 11 x 10 deg area with approximately 9 km grid spacing. There were a total of 88 x 170 grid points in the nest. The d03 domain covered a 6 x 5.5 deg area with approximately 3 km grid spacing. There were a total of 154 x 272 grid points in the nest. The location of the parent and nests as well as the pole of the projection, varied from run to run and were dictated by the location of the storm at the time of initialization.
HWRF was run coupled to the POM ocean model, In the Atlantic, a three-dimensional configuration of the POM-TC was employed, while in the Pacific a column (one-dimensional) configuration of POM-TC was used. The POM domain for the Atlantic storms depended on the location of the storm at the initialization time and on the 72-h National Hurricane Center forecast for the storm location. Those parameters defined whether the East Atlantic or United domain of the POM was used.
The image shows the atmospheric parent (shaded) and nest domains (black outline) and the United POM domain (pink outline).
Click on the image to enlarge
Cases Run
• Storms: 35 complete storms from the 2012 season.
• 2012 Atlantic: Alberto, Beryl, Chris, Debby, Ernesto, Helene,
Gordon, Isaac, Joyce, Kirk, Leslie, Michael, Nadine, Oscar, Patty,
Rafael, Sandy, Tony
• 2012 Pacific: Aletta, Bud, Carlotta, Daniel, Emilia, Fabio,
Gilma, Hector, Ileana, John, Kristy, Lane, Miriam, Norman, Olivia,
Paul, Rosa
• Initializations: Every 6 h, in cycled mode.
• Forecast Length: 126 hours; output files available every 6 hours
Verification
The characteristics of the forecast storm (location, intensity, structure) were compared against the Best Track using the National Hurricane Center (NHC) Verification System (NHCVx). The NHCVx was run separately for each case, at 6-hourly forecast lead times, out to 120 h, in order to generate a distribution of errors. Verification was performed for any geographical location for which Best Track was available, including over land. No verification was performed when the observed storm was classified as a low or wave.
An R-statistical language script was run on an homogenous sample of the HDFL and HD21 datasets to aggregate the errors and to create summary metrics including the mean and median of track error, intensity error, absolute intensity error, and radii of 34, 50, and 64 kt wind in all four quadrants. All metrics are accompanied of 95% confidence intervals to describe the uncertainty in the results due to sampling limitations.
For the purposes of comparing the HDFL and HD21 forecasts, pairwise differences (HDFL-HD21) of track error, and absolute intensity error, and absolute wind radii error were computed and aggregated with a R-statistical language script. Ninety-five percent confidence intervals on the median were computed to determine if there is a statistically significant difference between the two configurations.