
WRF-RR Vertical Level Sensitivity Test

WRF-RR Vertical Level Sensitivity Test
- Code
- Domain
- Model
- Initialization
- Cases
- Verification
Codes Employed
The components of the end-to-end forecast system used in the WRFRR-VL Test included:
• WRF Preprocessing System (WPS) (v3.0)
• WRF-ARW model (v3.0)
• WRF Post Processor (WPP) (v3.0)
• NCEP Verification System
• NCAR Command Language (NCL) for graphics generation
• Statistical programming language, R, to compute confidence
intervals
Domain Configuration
• CONUS domain with roughly 13-km grid spacing (selected such
that it fits within the RUC13 domain)
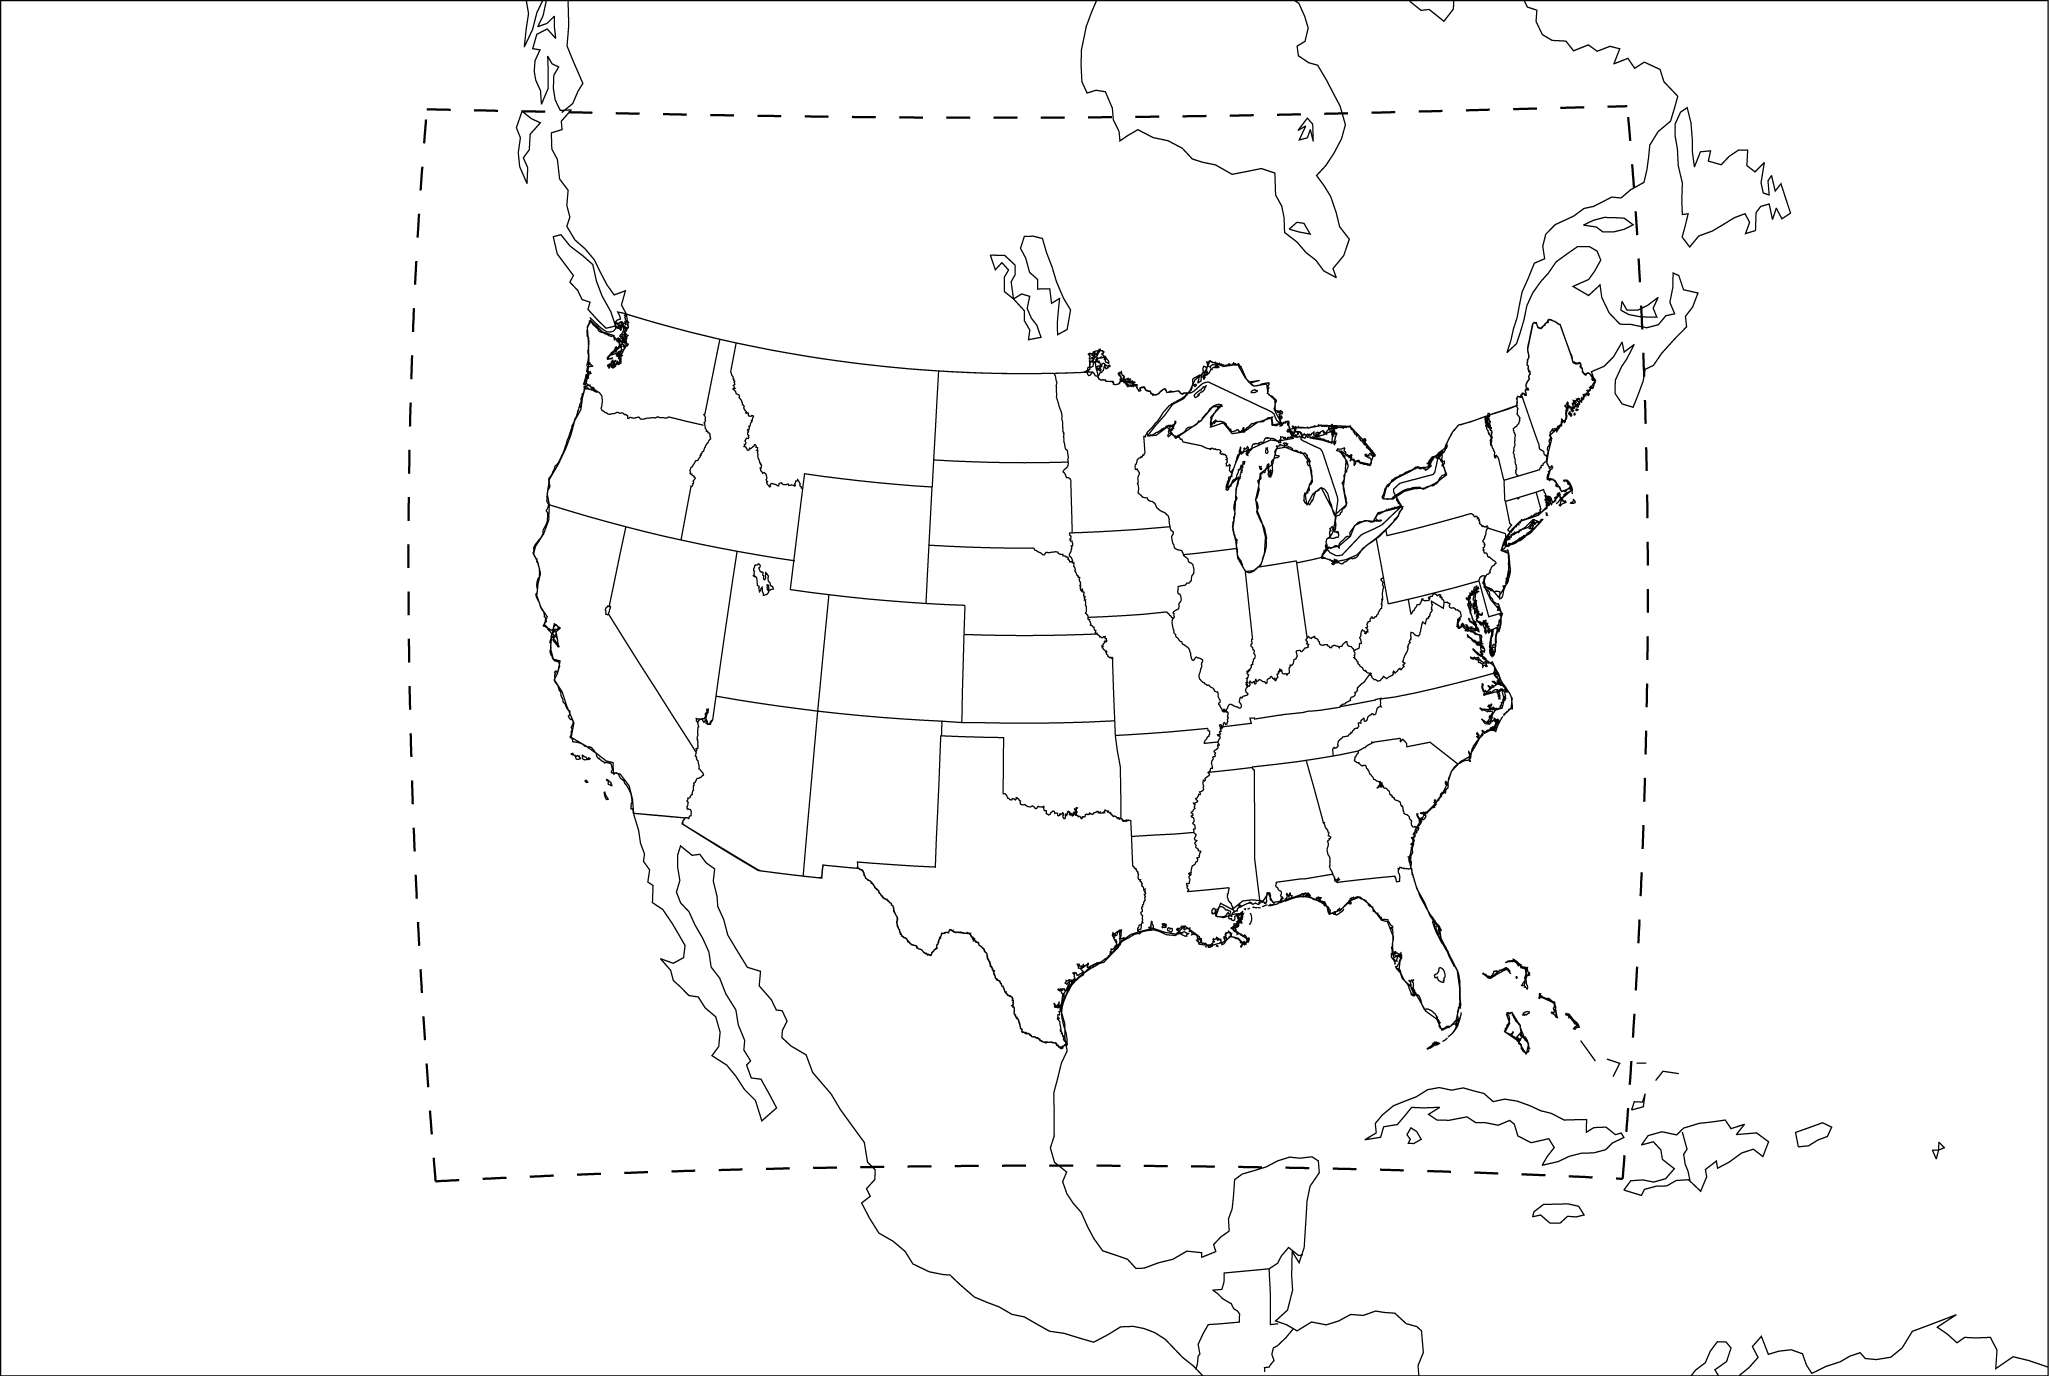 Click thumbnail for larger image.
• 400 x 304 gridpoints, for a total of 121,600 horizontal gridpoints
• 50 vertical levels (51 sigma entries) - The two configurations are
identical except for the for the distribution of the nine lowest sigma
levels.
Sample Namelists
namelist.wps
namelist.input for the high vertical resolution at low levels (ARW1)
Physics Suite
| Microphysics: | Thompson |
| Radiation (LW/SW): | RRTM/Dudhia |
| Surface Layer: | Janic |
| Land Surface: | RUC |
| PBL: | Mellor-Yamada-Janjic |
| Convection: | Grell-Devenyi Ensemble |
Other run-time settings
• Long timestep = 72 s; Acoustic timestep = 18 s
• Calls to the boundary layer, microphysics and cumulus
parameterization were made every time step
• Calls to radiation were made every 30 minutes
• Sample namelist.input for ARW1 and ARW2
While the end-to-end system for this test did not include a data assimilation component, the RUC13 cloud fields were included in the initial conditions, so the runs were not truly cold start forecasts in the sense of starting with no clouds; there was, however, no attempt to create an initial divergent wind component that is consistent with the initial clouds.
Initial and Boundary Conditions
• Initial conditions (ICs): Rapid Update Cycle (RUC13) model
• Lateral Boundary Conditions (LBCs): North American
Mesoscale Model (NAM212).
(Note: For the retrospective period used, the forecast
component of the NAM was the Eta model.)
• Sea Surface Temperature (SST) Initialization: NCEPs daily,
real-time SST product
Cases Run
• Forecast Dates: 25 March - 25 April 2006
• Initializations: 00 and 12 UTC every day
• Forecast Length: 24 hours; output files generated every 3
hours
The following cases did not successfully complete the entire end-to-end process due to the reason stated:
• 20060329 12 UTC - missing RFC analysis
• 20060402 00 UTC - corrupt RUC input
• 20060413 00 UTC - missing NAM input
• 20060417 12 UTC - missing RUC input
• 20060418 00 UTC - missing RUC input
• 20060423 00 UTC - missing RFC analysis
• 20060423 12 UTC - missing RFC analysis and RUC prepbufr
Verification
The NCEP Verification System is comprised of:
• Surface and Upper Air Verification System (grid-to-point
comparison)
• Quantitative Precipitation Forecast (QPF) Verification
System (grid-to-grid comparison)
From these, model verification partial sums (aggregated by geographical region using the mean) were generated and objective model verification statistics were then computed using the statistical programming language, R. Confidence intervals (CIs), at the 99% level, were applied to each of the variables using the appropriate statistical method.
Objective verification statistics generated included:
• Bias-corrected Root Mean Square Error (BCRMSE) and Mean
Error (Bias) for:
• Surface Temperature (2 m), Relative Humidity (2 m) and
Winds (10 m)
• Upper Air Temperature, Relative Humidity and Winds
• Equitable Threat Score (ETS) and Frequency Bias (FBias) for:
• 3-hr and 24-hr Precipiation Accumulation intervals
Since verification statistics were only computed for cases that ran to completion for both configurations of the model, pair-wise differences between the verification statistics of the two configurations are computed. The CIs on the pair-wise differences between statistics for the two configurations objectively determines whether the differences are statistically significant (SS).
Verification results were computed for select spatial aggregations, including the entire CONUS (G164), CONUS-West (G165), and CONUS-East (G166) domains.
Descriptions of the verification metrics computed can be found in Appendix B of the WRF-RR Vertical Levels Final Report.