
HWRF PS:85.98.98.88.88.2.84

HWRF PS:85.98.98.88.88.2.84 (H3RC) Configuration Description
- Code
- Model
- Domain
- Cases
- Verification
Codes Employed
The Community HWRF v3.3a public release was used to conduct the runs for the HWRF PS:85.98.98.88.88.2.84 (H3RC) Reference Configuration. Some bug fixes were applied to the WRF code as detailed in the Final Report. In addition, the following codes were employed:
• National Hurricane Center Verification System - revision 32
• Statistical Programming Language R for aggregation of verification
results and computation of confidence intervals
• DTC HWRF Testing and Evatuation suite (hwrf-tne) - revision 190
HWRF PS:85.98.98.88.88.2.4 (HNR2) Reference Configuration
| Microphysics: | Tropical Ferrier |
| Radiation (LW/SW): | GFDL/GFDL |
| Surface Layer: | GFDL |
| Land Surface: | GFDL slab model |
| PBL: | GFS |
| Convection: | Simplified Arakawa-Schubert |
Other run-time settings
• Domain 1 timestep = 54 s; Domain 2 timestep = 18 s
• Calls to the turbulence, cumulus parameterization and
microphysics were made every 4.5 minutes on Domain 1
and every 54 s on Domain 2
• Calls to radiation were made every 54 minutes on Domain 1
and every 9 minutes on Domain 2
• Coupling to the ocean model and nest motion are restricted to
a 9-minute interval
Domain Configuration
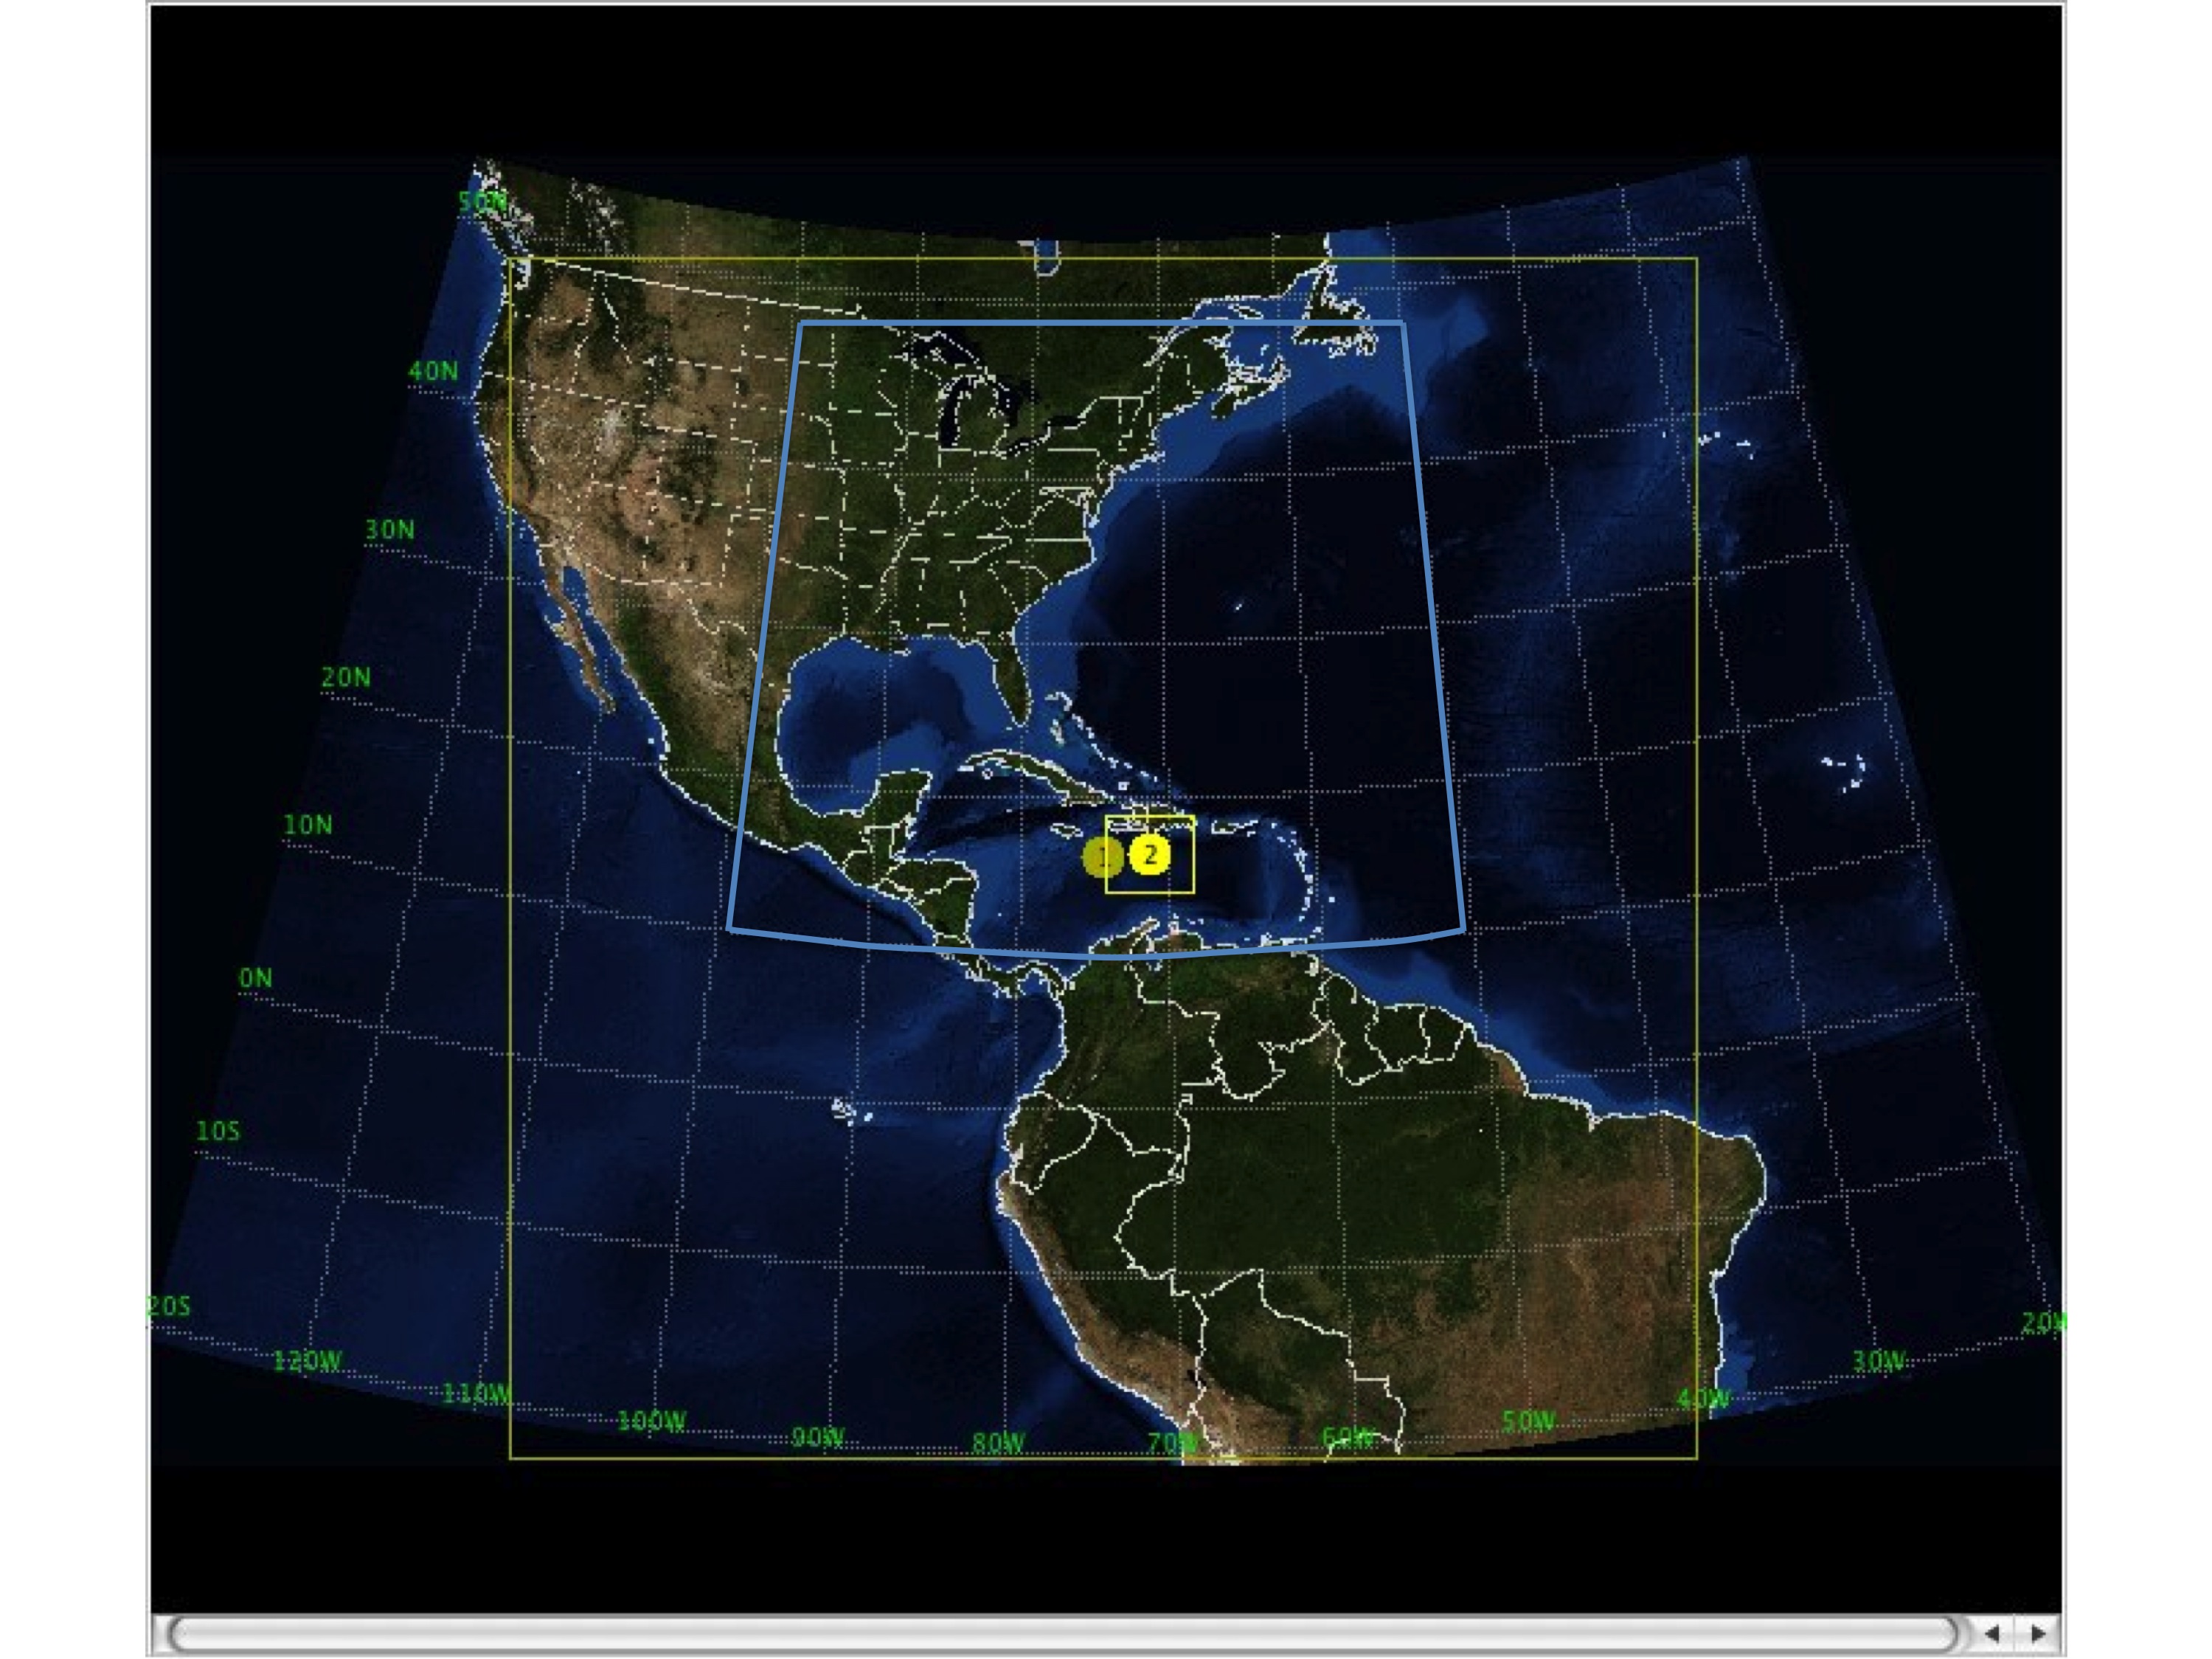
The HWRF domain was configured the same way as used in the NCEP/EMC operational system. The atmospheric model employed a parent and a movable nested grid. The parent grid covered a 75x75 deg area with approximately 27 km horizontal grid spacing. There were a total of 216 x 432 grid points in the parent grid. The nest covered a 5.4 x 5.4 deg area with approximately 9 km grid spacing. There were a total of 60 x 100 grid points in the nest. The location of the parent and nest, as well as the pole of the projection, varied from run to run and were dictated by the location of the storm at the time of initialization.
HWRF was run coupled to the POM ocean model for Atlantic storms and in atmosphere-only mode for East Pacific storms. The POM domain for the Atlantic storms depended on the location of the storm at the initialization time and on the 72-h NHC forecast for the storm location. Those parameters defined whether the East Atlantic or United domain of the POM was used.
The image shows the atmospheric parent and nest domains (yellow) and the United POM domain (blue).
 Click thumbnail for larger image.
Cases Run
• Storms: 59 complete storms from 2010 and 2011.
• 2010 Atlantic: Alex, Bonnie, Collin, Danielle, Earl, Fiona,
Gaston, Hermine, Igor, Julia, Karl, Lisa, Matthew, Nicole, Otto,
Paula, Richard, Shary, Tomas
• 2010 Pacific: Blas, Celia, Darby, Six, Estelle, Eight, Frank, Ten,
Eleven, Georgette
• 2011 Atlantic: Arlene, Bret, Cindy, Don, Emily, Franklin, Gert,
Harvey, Irene, Ten, Jose, Katia, Lee, Maria, Nate, Ophelia, Philippe,
Rina
• 2011 Pacific: Adrian, Beatriz, Calvin, Dora, Eugene, Fernanda,
Greg, Eight, Hillary, Jova, Irwin, Twelve
• Initializations: Every 6 h, in cycled mode.
• Forecast Length: 126 hours; output files available every 6 hours
Verification
The characteristics of the forecast storm (location, intensity, structure) were compared against the Best Track using the National Hurricane Center (NHC) Verification System (NHCVx). The NHCVx was run separately for each case, at 6-hourly forecast lead times, out to 120 h, in order to generate a distribution of errors. Verification was performed for any geographical location east of 140 W for which Best Track was available, including over land. No verification was performed when the observed storm was classified as a low or wave.
An R-statistical language script was run to aggregate the errors and to create summary metrics including the mean and median of track error, intensity error, absolute intensity error, and radii of 34, 50, and 64 kt wind in all four quadrants. All metrics are accompanied of 95% confidence intervals to describe the uncertainty in the results due to sampling limitations.