
Observation Sensitivity Tests for the Air force

Project Highlights
Sensitivity tests on regional scale model runs were preformed for the Air Force in order to assist with data and system configuration that optimize the use of new and proposed source of data for GSI. The DTC performed sensitivity studies for the following three data types in the list.
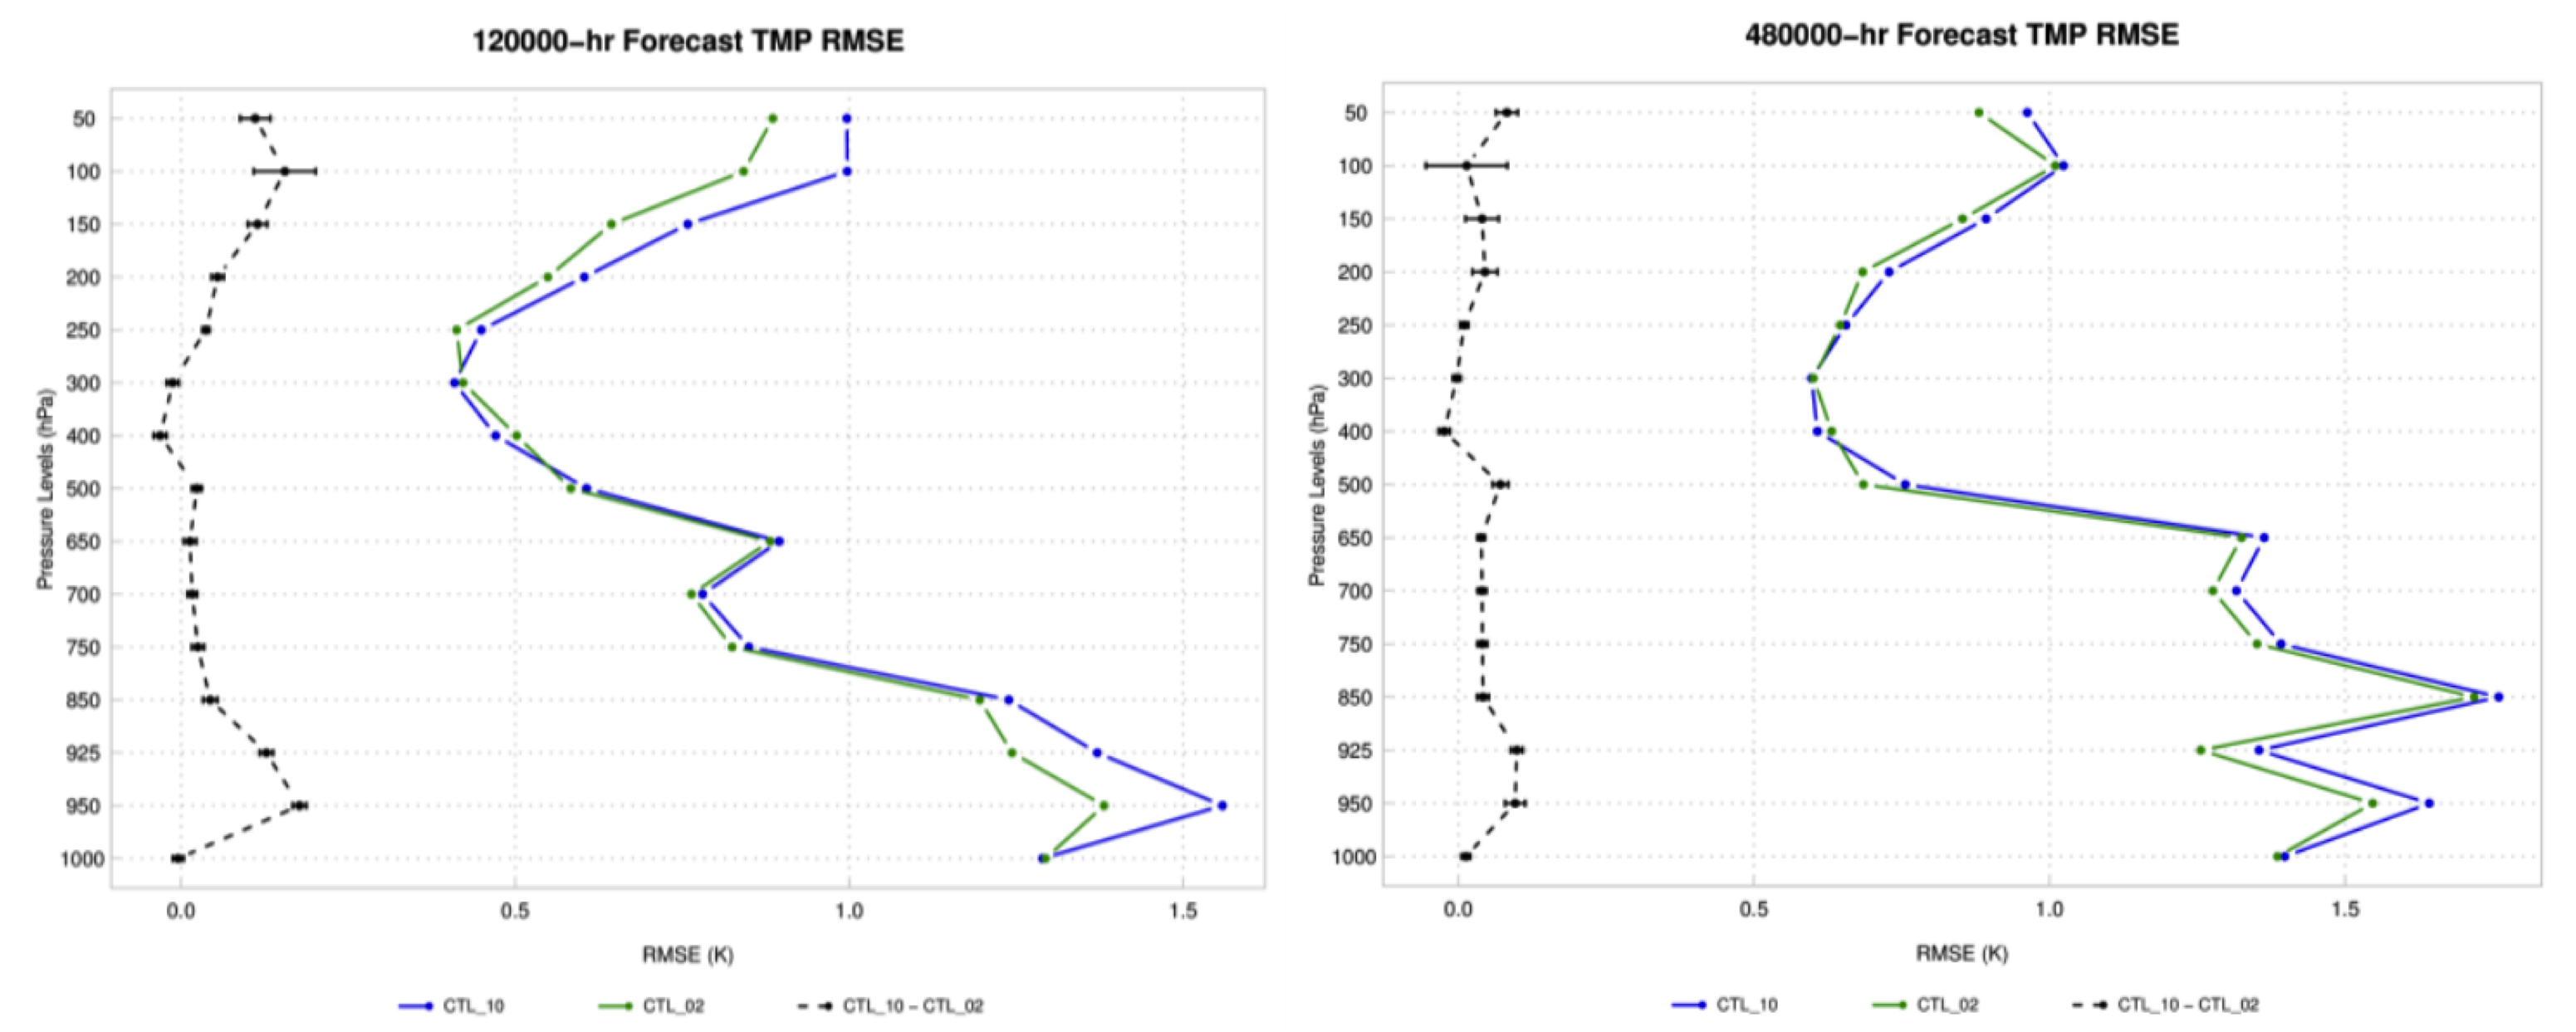
To enable the radiance and ozone DA, the DTC also performed tests to evaluate the latest ARW release with the model top increased from 10 hPa to 2 hPa. The model top increase generally showed positive impacts on the data assimilation and forecasts. Figure 1 shows the root-mean-square errors (RMSE) of temperature forecasts before and after the model top was increased. Statistically significant (SS) improvements associated with simply increasing the model top were found at both upper and lower levels.
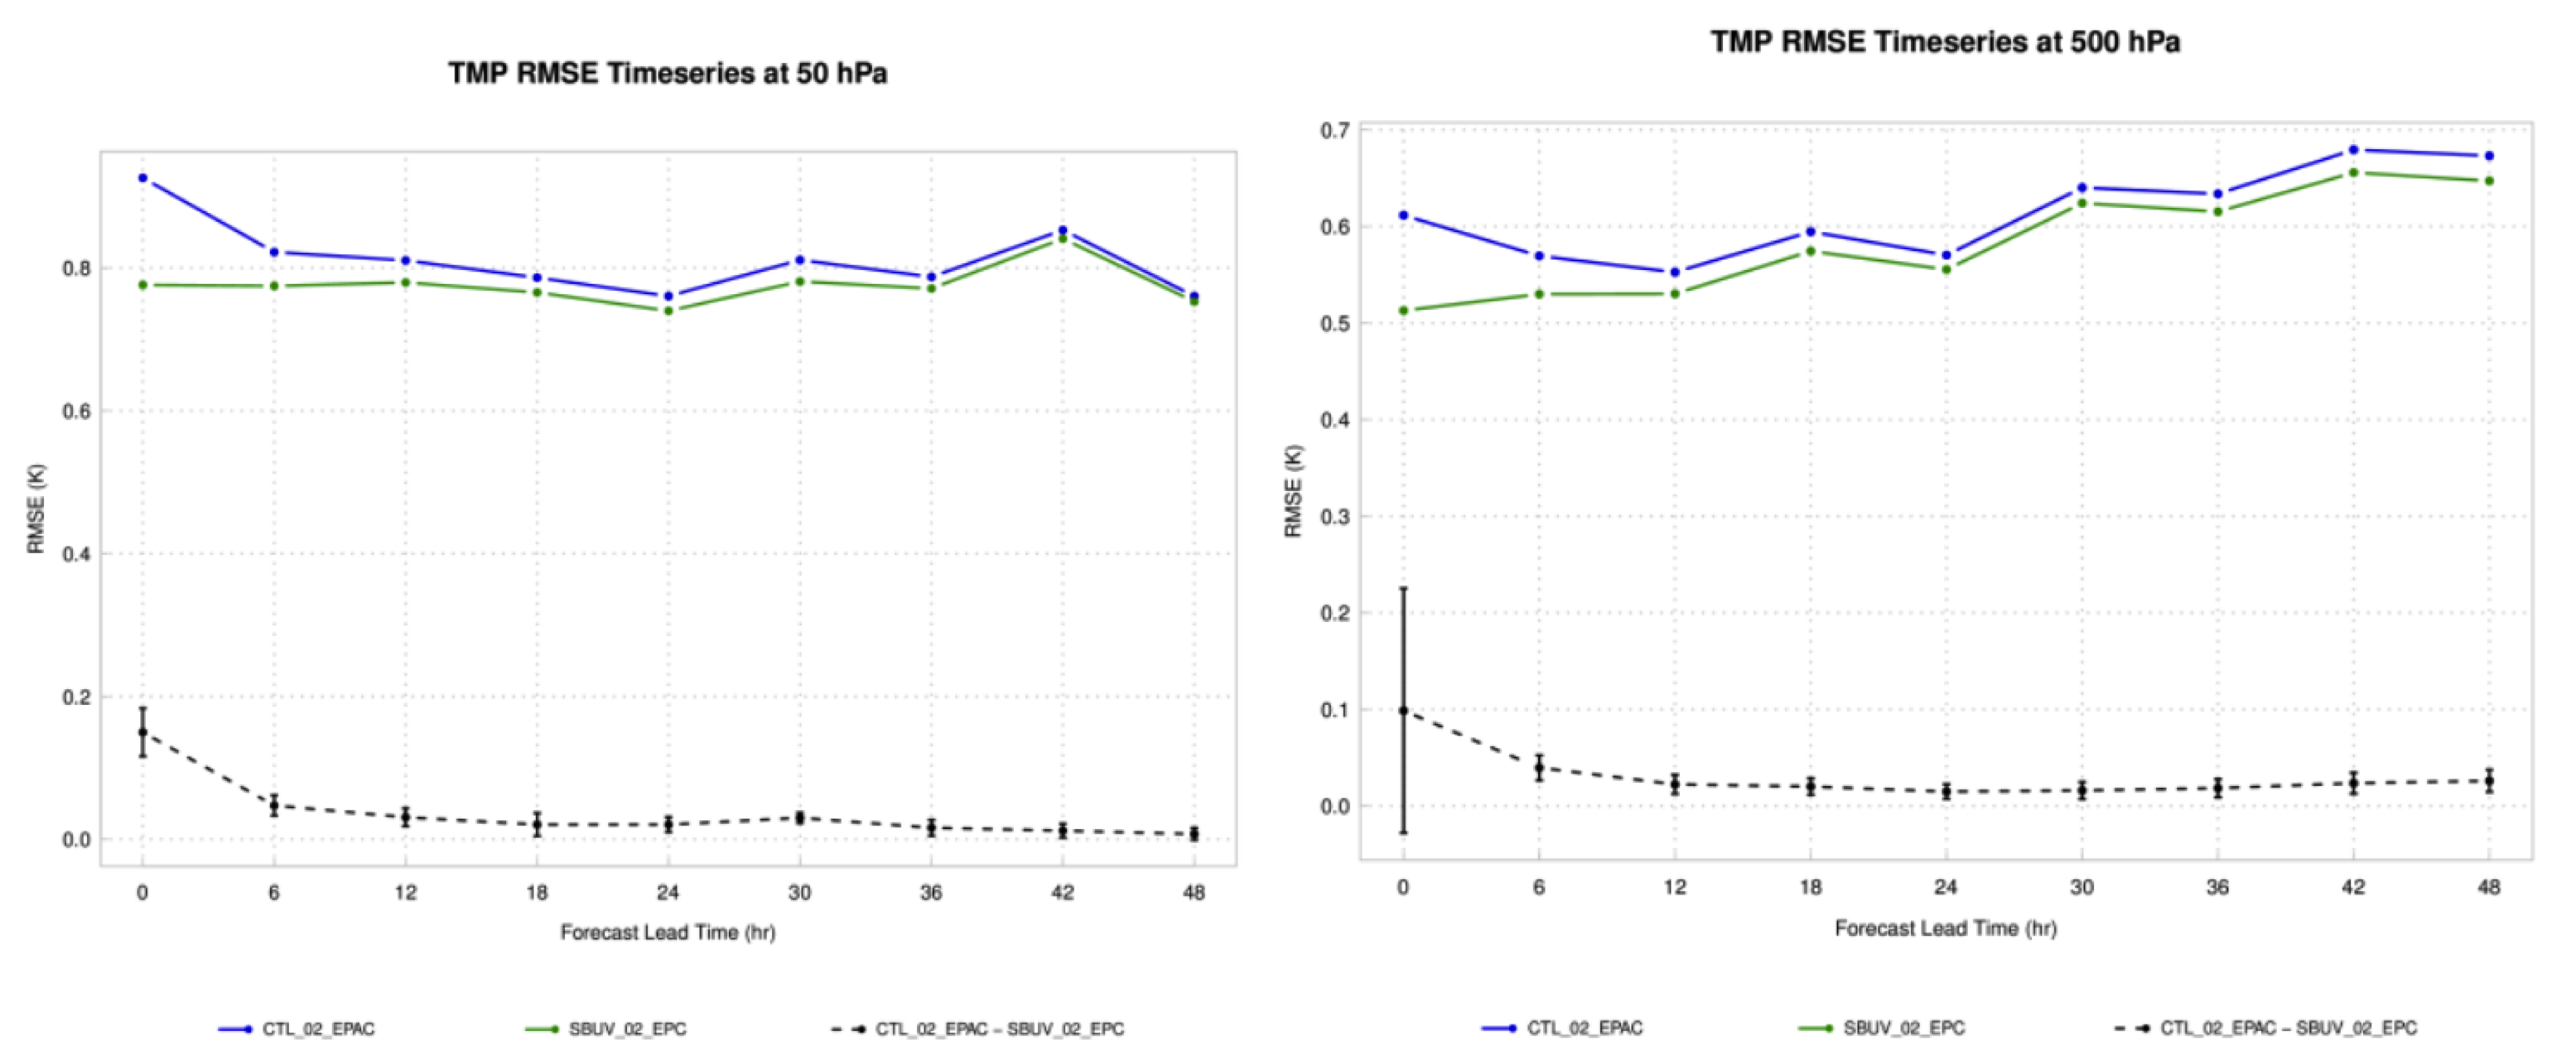
When focusing on the utility of ozone data in GSI coupled with ARW, there are signs of improvement, particularly in the upper levels of the earliest lead times for temperature and wind. It should be noted that ozone is not a prognostic variable in ARW. Therefore, to assimilate ozone data, NCEP’s Global Forecast System (GFS) ozone was added as the background. In addition, the RRTMG radiation scheme was used instead of RRTM/Dudhia schemes for both the control and ozone DA experiments. Impacts of ozone data assimilation on forecasts are indirect through the impacts of the radiation computation inside the radiative transfer model used by the GSI. Compared with GOME, assimilation of SBUV shows more promise with a slightly stronger signal for improvement and larger SS differences over the control configuration. Figure 2 shows times series of the RMSE for the temperature analyses and forecasts at 50 hPa and 500 hPa. Clear improvement is present due to the SBUV assimilation in this figure.
The DTC discovered neutral forecast impacts from CrIS data assimilation over the current operational suite, which includes both AIRS and IASI. The data overlap of CrIS and AIRS data may lessen the impact of CrIS data. Also, the DTC discovered the channel selection for the CrIS configuration may need some careful consideration to improve the utility of these data (through the FSO tool as in the project report).