
WRF Rapid Refresh Core Test

WRF Rapid Refresh Core Test
- Code
- Domain
- Model
- Initialization
- Cases
- Verification
Codes Employed
The components of the end-to-end forecast system used in the WRF Rapid Refresh Core Test included:
• Standard Initialization (SI) (Note: Each dynamic core has its own
approach to processing the input data and thus differences
between the initial and lateral boundary conditions, as well as the
static fields (e.g. terrain height) are possible.)
• WRF model (Note: The WRF code used in this test does not
correspond to a public release, but is based on WRF v2.0 with
significant changes and enhancements.)
• WRF Post Processor (WPP) (v2.0)
• NCEP Verification System
• NCAR Command Language (NCL) for graphics generation
• Statistical programming language, R, to compute aggregations
and confidence intervals
Domain Configuration
• CONUS domain with roughly 13-km grid spacing (selected such
that it fits within the RUC13 domain)
 Click thumbnail for larger image.
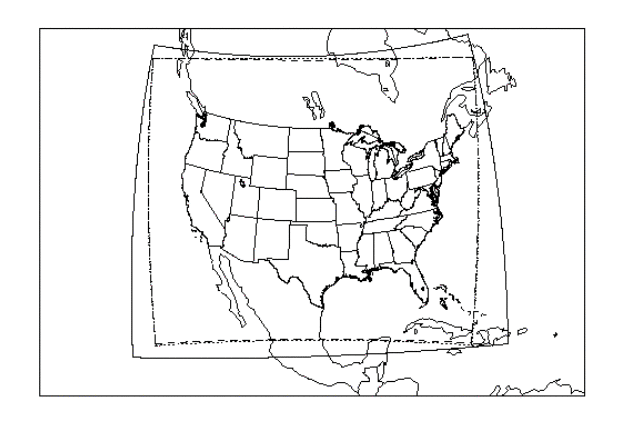
Figure above shows the boundaries of the computational domain used for the ARW (dashed line), the NMM (dotted line) and the post-processed domain (solid line), which corresponds to the RUC13 domain.
• Grid dimensions:
• NMM: 280 x 435 gridpoints, for a total of 121,800 horizontal
gridpoints
• ARW: 400 x 304 gridpoints, for a total of 121,600 horizontal
gridpoints
• Post-processed: 451 x 337 gridpoints, for a total of 151,987
horizontal gridpoints
• 50 vertical levels - (Note: An exact match in vertical levels is not
possible because the ARW uses a sigma-pressure vertical
coordinate, while the NMM uses a hybrid system, with sigma-
pressure levels below 300 hPa and isobaric levels aloft)
• Projections:
• NMM: Rotated Latitude-Longitude projection
• ARW: Lambert-Conformal map projection
Sample Namelists
ARW configuration:
SI namelist
namelist.input (for Physics Suite 1 (ph1))
namelist.input (for Physics Suite 2 (ph2))
NMM configuration:
SI namelist
namelist.input (for Physics Suite 1 (ph1))
namelist.input (for Physics Suite 2 (ph2))
Physics Suite 1 (ph1)
| Microphysics: | Ferrier |
| Radiation (LW/SW): | GFDL |
| Surface Layer: | Janic |
| Land Surface: | Noah |
| PBL: | Mellor-Yamada-Janjic |
| Convection: | Betts-Miller-Janjic |
• Sample namelist.input for ARW and NMM
Physics Suite 2 (ph2)
| Microphysics: | Thompson |
| Radiation (LW/SW): | GFDL |
| Surface Layer: | Janic |
| Land Surface: | RUC |
| PBL: | Mellor-Yamada-Janjic |
| Convection: | Grell-Devenyi |
• Sample namelist.input for ARW and NMM
Other run-time settings
• Timestep:
• ARW: Long timestep = 72 s; Acoustic timestep = 18 s
• NMM: Long timestep = 30 s
• Calls to the boundary layer, microphysics and cumulus
parameterization were made every time step for the ARW
(every 72 s) and every other time step for the NMM (every 60 s)
• Calls to radiation were made every 30 minutes
The end-to-end system for this test did not include a data assimilation component.
Initial and Boundary Conditions
• Initial conditions (ICs): 13-km Rapid Update Cycle (RUC13)
• Lateral Boundary Conditions (LBCs): North American
Mesoscale Model (NAM212) (Note: For the retrospective period
used, the forecast component of the NAM was the Eta model)
• Sea Surface Temperature (SST) Initialization: NCEPs daily,
real-time SST product
Cases Run
The ARW and NMM dynamic cores were used to forecast 252 cases divided into the four seasons. The runs were initialized every 12 h, therefore alternating 00 and 12 hr cycles, and run out to 24 hours.
| Summer: | 15 July - 15 August 2005 |
| Fall: | 1 - 30 November 2005 |
| Winter: | 15 January - 15 February 2006 |
| Spring: | 25 March - 25 April 2006 |
The table below lists the forecast cases that were not verified due to the reasons described in the table.
Missing Verification:
| Season | Affected Case | Missing Data | Physics package | Reason |
| Winter | 2006012600 | NMM | ph1 and ph2 | Forecast failed to complete |
| 2006012812 | NMM and ARW | ph1 and ph2 | Missing RUC input | |
| 2006012900 | NMM and ARW | ph1 and ph2 | Missing RUC input | |
| 2006020500 | ARW | ph2 | Forecast failed to complete | |
| 2006021500 | 3-hr QPF verification | ph1 and ph2 | Corrupt observation data | |
| 2006021512 | 3-hr QPF verification | ph1 and ph2 | Corrupt observation data | |
| Fall | 2005111012 | NMM and ARW | ph1 and ph2 | Missing RUC input |
| 2005110612 | ARW | ph2 | Forecast failed to complete | |
| 2005111600 | ARW | ph2 | Forecast failed to complete | |
| Summer | 2005071712 | NMM and ARW | ph1 and ph2 | Missing RUC input |
| 2005072300 | ARW post-processed files after f03 | ph2 | Post-processor crash related to small soil moisture values | |
| 2005072612 | ARW post-processed files after f21 | ph2 | Post-processor crash related to small soil moisture values | |
| 2005072700 | ARW post-processed files after f24 | ph2 | Post-processor crash related to small soil moisture values | |
| 2005072800 | ARW post-processed files after f21 | ph2 | Post-processor crash related to small soil moisture values | |
| Spring | 2006032500 | NMM and ARW | ph1 and ph2 | Corrupt RUC input |
| 2006032912 | 24h QPF verification | ph1 and ph2 | Missing RFC data | |
| 2006040200 | NMM and ARW | ph1 and ph2 | Corrupt RUC input | |
| 2006041300 | NMM and ARW | ph1 and ph2 | Missing NAM input | |
| 2006041712 | NMM and ARW | ph1 and ph2 | Missing RUC input | |
| 2006041800 | NMM and ARW | ph1 and ph2 | Missing RUC input | |
| 2006042300 | Incomplete sfcupa verification | ph1 and ph2 | Missing RUC prepbufr files | |
| 2006042312 | Incomplete sfcupa and 24h QPF verification | ph1 and ph2 | Missing RUC prepbufr files and RFC data |
Verification
The NCEP Verification System is comprised of:
• Surface and Upper Air Verification System (grid-to-point
comparison)
• Quantitative Precipitation Forecast (QPF) Verification
System (grid-to-grid comparison)
These packages provide model verification partial sums (aggregated by geographical region using the mean) that were used to compute objective model verification statistics. Confidence intervals (CIs), at the 99% level, were applied to each of the variables using the appropriate statistical method.
Objective verification statistics generated included:
• Root Mean Squared Error (RMSE) and Mean Error (Bias) for:
• Surface Temperature (2 m), Relative Humidity (2 m) and
Winds (10 m)
• Upper Air Temperature, Relative Humidity and Winds
• Equitable Threat Score (ETS) and Frequency Bias (FBias) for:
• 3-hr and 24-hr Precipiation Accumulation intervals
Verification statistics were only computed for cases that ran to completion for both configurations. This set up allowed for a pair-wise difference technique, which takes advantage of the fact that both configurations faced the same forecast challenge for all cases, to be employed in the determination of statistically significant differences between the two configurations. The CIs on the pair-wise differences between statistics for the two configurations objectively determines whether the differences are statistically significant (SS).
Verification results were computed for select spatial aggregations, including the entire CONUS (G164), CONUS-West (G165), and CONUS-East (G166) domains (shown here).