
WRFv3.1.1 ARW PS:4.1.1.1.2.1.1

WRFv3.1.1 ARW PS:4.1.1.1.2.1.1
- Code
- Domain
- Model
- Initialization
- Cases
- Verification
Codes Employed
The components of the end-to-end forecast system used for this test included:
• WRF Preprocessing System (WPS) (v3.1.1)
• WRF-ARW model (tag from the WRF Repository, based on v3.1.1
with a considerable number of updates)
• WRF Post Processor (WPP) (v3.1)
• Model Evaluation Tools (MET) (v3.0.1) *Includes PB2NC error described here
• NCAR Command Language (NCL) for graphics generation
• Statistical programming language, R, to compute confidence
intervals
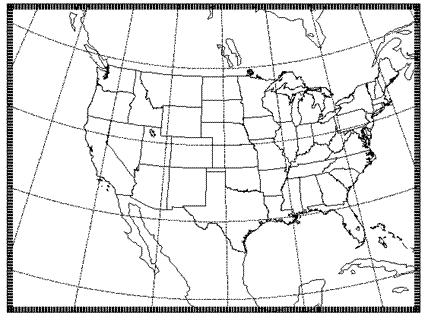
Domain Configuration
• Contiguous U.S. (CONUS) domain with 15-km grid spacing
 Click thumbnail for larger image.
• 403 x 302 gridpoints, for a total of 121,706 horizontal gridpoints
• 56 vertical levels (57 sigma entries); model top at 10 hPa
Sample Namelists
AFWA Reference Configuration
| Microphysics: | WRF Single-Moment 5 Scheme |
| Radiation (LW/SW): | RRTM/Dudhia |
| Surface Layer: | Monin-Obukhov Similarity Theory |
| Land Surface: | Noah |
| PBL: | Yonsei University Scheme |
| Convection: | Kain-Fritsch Scheme |
• Sample namelist.input
Other run-time settings
• Long timestep = 90 s; Acoustic step = 4
• Calls to the boundary layer and microphysics parameterization
were made every time step
• Calls to the cumulus parameterization were made every 5
minutes
• Calls to radiation were made every 30 minutes
The end-to-end system for this test did not include a data assimilation component.
Initial and Boundary Conditions
• Initial conditions (ICs) and Lateral Boundary Conditions
(LBCs): 0.5 x 0.5 degree Global Forecast System (GFS) model
• Lower Boundary Conditions (LoBCs): Agricultural
Meteorological Model (AGRMET) System output
• SST Initialization: Fleet Numerical Meteorology and
Oceanography Center (FNMOC) daily, real-time sea surface
temperature (SST) product
Cases Run
• Forecast Dates: 2 June 2008 - 31 May 2009
• Initializations: Every 36 hours, including both 00 and 12 UTC
• Forecast Length: 48 hours; output files generated every 3 hours
The tables below list the forecast initializations that failed to complete the end-to-end process due to the reasons described in the table. All incomplete forecasts were due to missing or bad input data sets, not model crashes.
Missing Forecasts:| Affected Case | Missing Data | Reason |
| 2008071000 | WRF Output | Missing SST Input Data |
| 2008091512 | WRF Output | Bad SST Input Data |
| 2008101512 | WRF Output | Bad SST Input Data |
| 2008101700 | WRF Output | Bad SST Input Data |
| 2008101812 | WRF Output | Bad SST Input Data |
| 2008102112 | WRF Output | Missing AGRMET Input Data |
| 2008121112 | WRF Output | Bas SST Input Data |
| 2009030100 | WRF Output | Missing SST Input Data |
| 2009040112 | WRF Output | Bad SST Input Data |
| 2009042212 | WRF Output | Bad SST Input Data |
| 2009052400 | WRF Output | Missing SST Input Data |
| 2009052512 | WRF Output | Missing SST Input Data |
Missing Verification:
| Affected Case | Missing Data | Reason |
| 2008071300 | Incomplete sfc and upper air verification beyond 33 h |
Missing Prepbufr data |
| 2008071412 | Incomplete sfc and upper air verification beyond 24 h |
Missing Prepbufr data |
| 2008101400 | Incomplete sfc and upper air verification beyond 39 h |
Missing Prepbufr data |
| 2009012700 | Incomplete sfc and upper air verification for 24-27 h |
Missing Prepbufr data |
Verification
The Model Evaluation Tools (MET) package, comprised of:
• grid-to-point comparisons - utilized for surface and upper air
model data
• grid-to-grid comparisons - utilized for QPF
was used to generate objective verification statistics, including:
• Bias-corrected Root Mean Square Error (BCRMSE), Root Mean
Square Error (RMSE) and Mean Error (Bias) for:
• Surface: Temperature (2 m), Dew Point Temperature (2 m)
and Winds (10 m)
• Upper Air: Temperature, Dew Point Temperature and Winds
• Gilbert Skill Score (GSS) and Frequency Bias (FBias) for:
• 3-hr and 24-hr Precipitation Accumulation intervals
Each type of verification metric is accompanied by confidence intervals (CIs), at the 99% level, computed using a parametric method for the surface and upper air variables and a boostrapping method for precipitation.
Area-averaged verification results were computed for the full domain, as well as 14 sub-domains.