
WRF v3.1.1

QNSE Sensitivity Test Description
- Code
- Domain
- Model
- Initialization
- Cases
- Verification
Codes Employed
The components of the end-to-end forecast system used in the QNSE Sensitivity Test included:
• WRF Preprocessing System (WPS) (v3.1.1)
• WRF-ARW model (tag from the WRF Repository, based on v3.1.1
with a considerable number of updates)
• WRF Post Processor (WPP) (v3.1)
• Model Evaluation Tools (MET) (v3.0.1) *Includes PB2NC error described here
• NCAR Command Language (NCL) for graphics generation
• Statistical programming language, R, to compute confidence
intervals
Domain Configuration
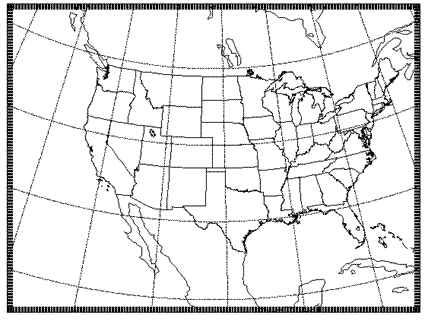
• A contiguous U.S. (CONUS) domain with 15-km grid spacing was employed for this test covering complex terrain, plains and coastal regions spanning from the Gulf of Mexico, north to Central Canada in order to capture diverse regional effects for worldwide comparability.
 Click thumbnail for larger image.
• 403 x 302 gridpoints, for a total of 121,706 horizontal gridpoints
• 56 vertical levels (57 sigma entries); model top at 10 hPa
• Lambert-Conformal map projection
Sample Namelists
• namelist.wps
• namelist.input based on the AFWA Operational Configuration
• namelist.input with QNSE replacement for PBL and surface layer
AFWA Reference Configuration
| Microphysics: | WRF Single-Moment 5 Scheme |
| Radiation (LW/SW): | RRTM/Dudhia |
| Surface Layer: | Monin-Obukhov Similarity Theory |
| Land Surface: | Noah |
| PBL: | Yonsei University Scheme |
| Convection: | Kain-Fritsch Scheme |
• Sample namelist.input
QNSE-replacement Configuration
| Microphysics: | WRF Single-Moment 5 Scheme |
| Radiation (LW/SW): | RRTM/Dudhia |
| Surface Layer: | QNSE |
| Land Surface: | Noah |
| PBL: | QNSE |
| Convection: | Kain-Fritsch Scheme |
• Sample namelist.input
Other run-time settings
• Long timestep = 90 s; Acoustic step = 4
• Calls to the boundary layer and microphysics parameterization
were made every time step
• Calls to the cumulus parameterization were made every 5
minutes
• Calls to radiation were made every 30 minutes
The end-to-end system for this test did not include a data assimilation component.
Initial and Boundary Conditions
• Initial conditions (ICs) and Lateral Boundary Conditions
(LBCs): 0.5 x 0.5 degree Global Forecast System (GFS) model
• Lower Boundary Conditions (LoBCs): Agricultural
Meteorological Model (AGRMET) System output
• SST Initialization: Fleet Numerical Meteorology and
Oceanography Center (FNMOC) daily, real-time sea surface
temperature (SST) product
Cases Run
• Forecast Dates: 2 June 2008 - 31 May 2009
• Initializations: Every 36 hours, including both 00 and 12 UTC
• Forecast Length: 48 hours; output files generated every 3 hours
| 00 UTC Initializations |
| June 2008: 4, 7, 10, 13, 16, 19, 22, 25, 28 |
| July 2008: 1, 4, 7, 10, 13, 16, 19, 22, 25, 28, 31 |
| August 2008: 3, 6, 9, 12, 15, 18, 21, 24, 27, 30 |
| September 2008: 2, 5, 8, 11, 14, 17, 20, 23, 26, 29 |
| October 2008: 2, 5, 8, 11, 14, 17, 20, 23, 26, 29 |
| November 2008: 1, 4, 7, 10, 13, 16, 19, 22, 25, 28 |
| December 2008: 1, 4, 7, 10, 13, 16, 19, 22, 25, 28, 31 |
| January 2009: 3, 6, 9, 12, 15, 18, 21, 24, 27, 30 |
| February 2009: 2, 5, 8, 11, 14, 17, 20, 23, 26 |
| March 2009: 1, 4, 7, 10, 13, 16, 19, 22, 25, 28, 31 |
| April 2009: 3, 6, 9, 12, 15, 18, 21, 24, 27, 30 |
| May 2009: 3, 6, 9, 12, 15, 18, 21, 24, 27, 30 |
| 12 UTC Initializations |
| June 2008: 2, 5, 8, 11, 14, 17, 20, 23, 26, 29 |
| July 2008: 2, 5, 8, 11, 14, 17, 20, 23, 26, 29 |
| August 2008: 1, 4, 7, 10, 13, 16, 19, 22, 25, 28, 31 |
| September 2008: 3, 6, 9, 12, 15, 18, 21, 24, 27, 30 |
| October 2008: 3, 6, 9, 12, 15, 18, 21, 24, 27, 30 |
| November 2008: 2, 5, 8, 11, 14, 17, 20, 23, 26, 29 |
| December 2008: 2, 5, 8, 11, 14, 17, 20, 23, 26, 29 |
| January 2009: 1, 4, 7, 10, 13, 16, 19, 22, 25, 28, 31 |
| February 2009: 3, 6, 9, 12, 15, 18, 21, 24, 27 |
| March 2009: 2, 5, 8, 11, 14, 17, 20, 23, 26, 29 |
| April 2009: 1, 4, 7, 10, 13, 16, 19, 22, 25, 28 |
| May 2009: 1, 4, 7, 10, 13, 16, 19, 22, 25, 28, 31 |
The tables below list the forecast initializations that failed to complete the end-to-end process due to the reasons described in the table. All incomplete forecasts were due to missing or bad input data sets, not model crashes. Given these missing data sets, the final number of forecasts run was 237 with 7 other cases missing some QPF verification.
Missing Forecasts:| Affected Case | Missing Data | Reason |
| 2008091512 | WRF Output | Bad SST Input Data |
| 2008101512 | WRF Output | Bad SST Input Data |
| 2008101700 | WRF Output | Bad SST Input Data |
| 2008101812 | WRF Output | Bad SST Input Data |
| 2008102112 | WRF Output | Missing AGRMET Input Data |
| 2009030100 | WRF Output | Missing SST Input Data |
| 2009040112 | WRF Output | Bad SST Input Data |
Missing Verification:
| Affected Case | Missing Data | Reason |
| 2008062712 | Incomplete 24-hr QPF verification | Missing RFC analysis |
| 2008063012 | Incomplete 24-hr QPF verification | Missing RFC analysis |
| 2008080312 | Incomplete 24-hr QPF verification | Missing RFC analysis |
| 2008082612 | Incomplete 24-hr QPF verification | Missing RFC analysis |
| 2008090112 | Incomplete 24-hr QPF verification | Missing RFC analysis |
| 2008110100 | Incomplete 3-hr QPF verification | Missing ST2 analysis |
| 2008110212 | Incomplete 3-hr QPF verification | Missing ST2 analysis |
Verification
The Model Evaluation Tools (MET) package, comprised of:
• grid-to-point comparisons - utilized for surface and upper air
model data
• grid-to-grid comparisons - utilized for QPF
was used to generate objective verification statistics, including:
• Bias-corrected Root Mean Square Error (BCRMSE) and Mean
Error (Bias) for:
• Surface: Temperature (2 m), Dew Point Temperature (2 m)
and Winds (10 m)
• Upper Air: Temperature, Dew Point Temperature and Winds
• Equitable Threat Score (ETS) and Frequency Bias (FBias) for:
• 3-hr and 24-hr Precipiation Accumulation intervals
Each type of verification metric is accompanied by confidence intervals (CIs), at the 99% level, computed using a parametric method for the surface and upper air variables and a boostrapping method for precipitation.
Both configurations were run for the same cases allowing for a pair-wise difference methodology to be applied, as appropriate. The CIs on the pair-wise differences between statistics for the two configurations objectively determines whether the differences are statistically significant (SS).
To establish practical significance (PS) in order to examine SS pair-wise differences that are potentially more meaningful, the data was censored to only look at differences that were greater than the operational measurement uncertainty requirements as defined by the World Meteorological Organization (WMO). The following criteria were applied to determine PS pair-wise differences between the configurations and versions for each variable: i) temperature and dew point temperature differences greater than 0.1K, ii) wind speed differences greater than 0.5 ms-1, iii) and precipitation differences greater than 0.1 mm.
Area-averaged verification results were computed for the full domain, as well as 14 sub-domains.