
WRF v3.8.1

AF Configuration/Version Sensitivity Test Description
- Code
- Domain
- Model
- Initialization
- Cases
- Verification
Codes Employed
The components of the end-to-end forecast system used in the AF configuration and version testing included:
• WRF Preprocessing System (WPS) (v3.5.1 / v3.8.1)
• WRF-ARW model (v3.5.1 / v3.8.1)
• Unified Post Processor (UPP) (v2.1 / v3.1)
• Model Evaluation Tools (MET) (v4.1 / v5.2)
• NCAR Command Language (NCL) for graphics generation
• Statistical programming language, R, to compute confidence
intervals
Domain Configuration
• Near-North American domain with 15-km grid spacing
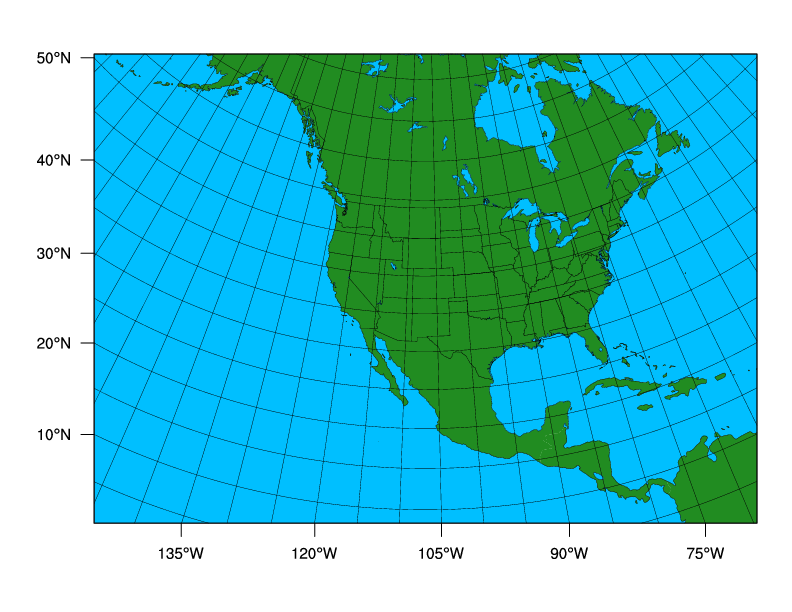 Click thumbnail for larger image.
• 656 x 464 gridpoints, for a total of 304,384 horizontal gridpoints
• 56 vertical levels (57 sigma entries); model top at 10 hPa
• Lambert-Conformal map projection
Sample Namelists
• namelist.wps
• namelist.input_v3.5.1
• namelist.input_v3.8.1
AF v3.5.1 Configuration
| Microphysics: | WRF Single-Moment 5 Scheme (opt 4) |
| Radiation: | RRTM (lw) / Dudhia (sw) (opt 1) |
| Surface Layer: | MM5 Similarity Scheme (opt 1) |
| Land Surface: | Noah (opt 2) |
| PBL: | Yonsei University Scheme (opt 1) |
| Convection: | Kain-Fritsch Scheme (opt 1) |
Other run-time settings
• Long timestep = 90 s; Acoustic step = 4
• Calls to the boundary layer and microphysics parameterization
were made every time step
• Calls to the cumulus parameterization were made every 5
minutes
• Calls to radiation were made every 30 minutes
Sample namelist.input
AF v3.8.1 Configuration
| Microphysics: | Thompson aerosol-aware Scheme (opt 28) |
| Radiation: | RRTMG (opt 4) |
| Surface Layer: | Revised MM5 surface layer Scheme (opt 1) |
| Land Surface: | Noah (opt 2) |
| PBL: | Yonsei University Scheme (opt 1) |
| Convection: | Kain-Fritsch Scheme (opt 1) |
Other run-time settings
• Long timestep = 60 s; Acoustic step = 4
• Calls to the boundary layer and microphysics parameterization
were made every time step
• Calls to the cumulus parameterization were made every 5
minutes
• Calls to radiation were made every 30 minutes
• Used an auxiliary aerosol climatology file
Sample namelist.input
Initial and Boundary Conditions
• Initial conditions (ICs) and Lateral Boundary Conditions
(LBCs): 0.5 x 0.5 degree Global Forecast System (GFS) model
• SST Initialization: Fleet Numerical Meteorology and
Oceanography Center (FNMOC) daily, real-time sea surface
temperature (SST) product
Preprocessing Component
The time-invariant component of the lower boundary conditions (topography, soil and vegetation type etc.), using United States Geological Survey (USGS) input data, was generated through the geogrid program of WPS.
An auxiliary aerosol climatology file that included mass mixing ratios of sulfates, sea salts, organic carbon, dust, and black carbon from the 7-year simulation with 0.5-degree longitude by 1.25-degree latitude spacing was used in the metgrid program of WPS.
Cases Run
• Forecast Dates: Summer:1 July 2011 - 30 September 2011
Winter: 1 January 2012 - 31 March 2012
• Initializations: Every 36 hours, including both 00 and 12 UTC
• Forecast Length: 48 hours; output files generated every 3 hours
| 00 UTC Initializations |
| July 2011: 1, 4, 7, 10, 13, 16, 19, 22, 25, 28, 31 |
| August 2011: 3, 6, 9, 12, 15, 18, 21, 24, 27, 30 |
| September 2011: 2, 5, 8, 11, 14, 17, 20, 23, 26, 29 |
| January 2012: 3, 6, 9, 12, 15, 18, 21, 24, 27, 30 |
| February 2012: 2, 5, 8, 11, 14, 17, 20, 23, 26, 29 |
| March 2012: 3, 6, 9, 12, 15, 18, 21, 24, 27, 30 |
| 12 UTC Initializations |
| July 2011: 2, 5, 8, 11, 14, 17, 20, 23, 26, 29 |
| August 2011: 1, 4, 7, 10, 13, 16, 19, 22, 25, 28, 31 |
| September 2011: 3, 6, 9, 12, 15, 18, 21, 24, 27, 30 |
| January 2012: 1, 4, 7, 10, 13, 16, 19, 22, 25, 28, 31 |
| February 2012: 3, 6, 9, 12, 15, 18, 21, 24, 27 |
| March 2012: 1, 4, 7, 10, 13, 16, 19, 22, 25, 28, 31 |
The tables below list the forecast initializations that failed to complete the end-to-end process due to the reasons described in the table. All incomplete forecasts were due to missing or bad input data sets, not model crashes.
Missing Forecasts:| Affected Case | Missing Data | Reason |
| 2011071712 | WRF Output | Missing SST Input Data |
| 2011080112 | WRF Output | Missing SST Input Data |
| 2011082400 | WRF Output | Missing SST Input Data |
| 2012011012 | WRF Output | Missing GFS input data |
| 2012011612 | WRF Output | Missing GFS input data |
| 2012012212 | WRF Output | Missing GFS input data |
Missing Verification:
| Affected Case | Missing Data | Reason |
| 2011072500 | Missing 3-h QPF verification for 18 21-h Missing 24-h QPF verification for 36-h |
Missing ST2 analysis |
Verification
The Model Evaluation Tools (MET) package, comprised of:
• grid-to-point comparisons - utilized for surface and upper air
model data
• grid-to-grid comparisons - utilized for QPF
was used to generate objective verification statistics, including:
• Bias-corrected Root Mean Square Error (BCRMSE) and Mean
Error (Bias) for:
• Surface: Temperature (2 m), dew point temperature (2 m)
and winds (10 m)
• Upper Air: Temperature, dew point temperature and winds
• Gilbert Skill Score (GSS) and frequency bias (FBias) for:
• 3-hr and 24-hr precipiation accumulation intervals
Each type of verification metric is accompanied by confidence intervals (CIs), at the 99% level, computed using a parametric method for the surface and upper air variables and a boostrapping method for precipitation.
Both configurations were run for the same cases allowing for a pair-wise difference methodology to be applied, as appropriate. The CIs on the pair-wise differences between statistics for the two configurations objectively determines whether the differences are statistically significant (SS).
To establish practical significance (PS) in order to examine SS pair-wise differences that are potentially more meaningful, the data was censored to only look at differences that were greater than the operational measurement uncertainty requirements as defined by the World Meteorological Organization (WMO). The following criteria were applied to determine PS pair-wise differences between the configurations and versions for select variables: i) temperature and dew point temperature differences greater than 0.1K and ii) wind speed differences greater than 0.5 ms-1.
Area-averaged verification results were computed for the full and CONUS domains, East and West domains, and 14 sub-domains.