
NAM Configuration Testing

NAM Configuration Testing Description
- Code
- Domain
- Model
- Initialization
- Cases
- Verification
Codes Employed
The components of the end-to-end forecast system used in the microphysics parameterization testing included:
• NEMS Preprocessing System (NPS) (v0.9)
• NEMS-NMMB model (v0.9)
• Unified Post Processor (UPP) (v2.2 with modifications)
• Model Evaluation Tools (MET) (v5.0)
• NCAR Command Language (NCL) for graphics generation
• Statistical programming language, R, to compute confidence
intervals
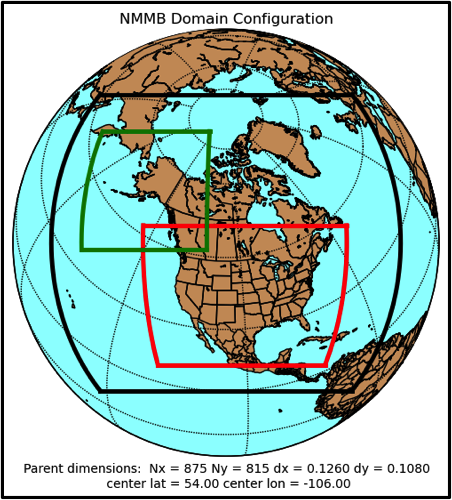
Domain Configuration
• 12-km North American domain (black)
• 3-km CONUS domain (red)
• 3-km Alaska domain (green)
 Click thumbnail for larger image.
• North American domain: 875 x 815 gridpoints, for a total of 713,125 horizontal gridpoints
• CONUS domain: 1371 x 1100 gridpoints, for a total of 1,508,100 horizontal gridpoints
• Alaska domain: 595 x 625 gridpoints, for a total of 371,875 horizontal gridpoints
• 60 vertical levels; model top at 10 hPa
• Rotated latitude/longitude map projection
Sample Namelist/Configure Files
• namelist.nps_input
• configure_file_01 (NAMOC)
• configure_file_02 (NAMOC)
• configure_file_03 (NAMOC)
• configure_file_01 (ThompsonMP)
• configure_file_02 (ThompsonMP)
• configure_file_03 (ThompsonMP)
NEMS-NMMB Reference Configuration (NAMOC)
| Microphysics: | Ferrier-hires |
| Radiation (LW/SW): | RRTM |
| Surface Layer: | MYJ |
| Land Surface: | Noah |
| PBL: | MYJ |
| Convection: | BMJ (Parent only) |
Sample NAMOC configure_file_01
NEMS-NMMB Test Configuration (ThompsonMP)
| Microphysics: | Thompson |
| Radiation (LW/SW): | RRTM |
| Surface Layer: | MYJ |
| Land Surface: | Noah |
| PBL: | MYJ |
| Convection: | BMJ (Parent only) |
Sample ThompsonMP configure_file_01
Other run-time settings
• Dynamic timestep = 6 2/3 s (26 2/3 s for North American domain)
• Calls to the boundary layer and microphysics were made every 5th timestep (6th for North American domain) and every timestep when Thompson microphysics was used
• Calls to radiation were made every 135th timestep (90th for Alaska domain)
Initial and Boundary Conditions
• Initial conditions (ICs) and Lateral Boundary Conditions
(LBCs): Parallel NAM (NAMX, grid 151)
Preprocessing Component
The time-invariant component of the lower boundary conditions (topography, soil and vegetation type etc.), using the International Geosphere-Biosphere Programme (IGBP) input data, were generated through the geogrid program of NPS.
Cases Run
• Forecast Date Range: October 2013 - May 2014
• Initializations: Both 00 and 12 UTC
• Forecast Length: 48 hours; output files generated every 3 hours
| 00 UTC Initializations |
| October 2013: 12, 15, 18, 21, 24, 27, 30 |
| November 2013: 2, 5, 8, 11, 14 |
| January 2014: 16, 19, 22, 25, 28, 31 |
| February 2014: 3, 6, 9, 12, 15, 18 |
| April 2014: 16, 19, 22, 25, 28 |
| May 2014: 1, 4, 7, 10, 13, 16 |
| July 2014: 6, 9, 12, 15, 18, 21, 24, 27, 30 |
| August 2014: 2, 5, 8 |
| 12 UTC Initializations |
| October 2013: 13, 16, 19, 22, 25, 28, 31 |
| November 2013: 3, 6, 9, 12, 15 |
| January 2014: 17, 20, 23, 26, 29 |
| February 2014: 1, 4, 7, 10, 13, 16, 19 |
| April 2014: 17, 20, 23, 26, 29 |
| May 2014: 2, 5, 8, 11, 14, 17 |
| July 2014: 7, 10, 13, 16, 19, 22, 25, 28, 31 |
| August 2014: 3, 6, 9 |
The tables below list the forecast initializations that failed to complete the end-to-end process due to the reasons described in the table. All incomplete forecasts were due to missing or bad input data sets, not model crashes.
Missing Forecasts:| Affected Case | Missing Data | Reason |
| 2013101800 | Model Output | Missing NAMX input data |
| 2013110500 | Model Output | Missing NAMX input data |
| 2014012312 | Model Output | Missing NAMX input data |
| 2014020412 | Model Output | ThompsonMP model crash |
| 2014041712 | Model Output | Missing NAMX input data |
| 2014072512 | Model Output | Missing NAMX input data |
| 2014072700 | Model Output | Missing NAMX input data |
| 2014080612 | Model Output | Missing NAMX input data |
Missing Verification:
| Affected Case | Missing Data | Reason |
| 2013110612 | Missing reflectivity for 6,9,15,18,21,24,27,30-h forecast | Missing radar observation file |
| 2013111512 | Missing reflectivity for 39,42,45-h forecast | Missing radar observation file |
| 2014021312 | Missing reflectivity for 18,21,48-h forecast | Missing radar observation file |
| 2014021500 | Missing reflectivity for 12-h forecast | Missing radar observation file |
| 2014042012 | Missing reflectivity for 48-h forecast | Missing radar observation file |
| 2014042200 | Missing reflectivity for 12-h forecast | Missing radar observation file |
| 2014072100 | Missing reflectivity for 48-h forecast | Missing radar observation file |
| 2014072212 | Missing reflectivity for 12-h forecast | Missing radar observation file |
| 2014073000 | Missing reflectivity for 48-h forecast | Missing radar observation file |
| 2014073112 | Missing reflectivity for 12-h forecast | Missing radar observation file |
| 2014080500 | Missing reflectivity for 24-h forecast | Missing radar observation file |
Verification
The Model Evaluation Tools (MET) package, comprised of:
• grid-to-point comparisons - utilized for surface and upper air
model data
• grid-to-grid comparisons - utilized for QPF and composite
reflectivity
MET was used to generate objective verification statistics, including:
• Bias-corrected Root Mean Square Error (BCRMSE) and Mean
Error (Bias) for:
• Surface: Temperature (2 m), Dew Point Temperature (2 m)
and Winds (10 m)
• Upper Air: Temperature, Dew Point Temperature and Winds
• Gilbert Skill Score (GSS) and Frequency Bias (FBias) for:
• 3-hr and 24-hr Precipiation Accumulation intervals
• Composite Reflectivity
Each type of verification metric is accompanied by confidence intervals (CIs), at the 99% level, computed using a parametric method for the surface and upper air variables and a boostrapping method for precipitation.
Both configurations were run for the same cases allowing for a pair-wise difference methodology to be applied, as appropriate. The CIs on the pair-wise differences between statistics for the two configurations objectively determines whether the differences are statistically significant (SS).
To establish practical significance (PS) in order to examine SS pair-wise differences that are potentially more meaningful, the data was filtered to only highlight differences that were greater than the operational measurement uncertainty requirements as defined by the World Meteorological Organization (WMO). The following criteria were applied to determine PS pair-wise differences between the configurations for select variables: i) temperature and dew point temperature differences greater than 0.1K and ii) wind speed differences greater than 0.5 ms-1.
Area-averaged verification results were computed for the Full and CONUS domains, CONUS East and West domains, 14 CONUS sub-domainss, and Alaska full and 2 sub-domains.