
Advanced Physics Testing

Vertical Profiles of Wind and Thermodynamic Variables
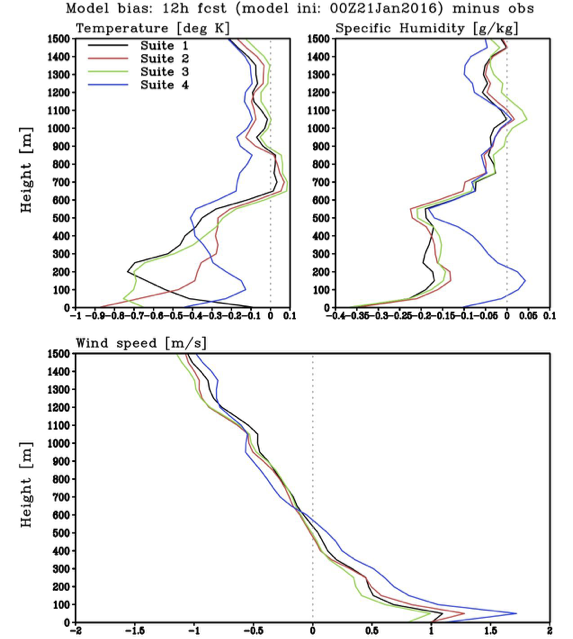
The planetary boundary layer structures were compared between forecasts and the observed soundings. The figure below shows the average bias of temperature, relative humidity, and wind speed for the 12-h forecast initialized at 00 UTC on January 21, 2016. Suite 1 is black, Suite 2 is red, Suite 3 is green, and Suite 4 is blue. All four suites exhibit a cold and dry bias and overmixing from surface to about 600 m.
More results can be found at:
GMTB's Final Report
Tar file of additional results