
RIRW Verification

RIRW Verification: Model Version Comparison
RI Contingency tables
30kt in 24-h |
|||
|---|---|---|---|
| OBS | |||
| Yes | No | ||
| FCST | Yes | 81 | 1084 |
| No | 183 | 28605 | |
25kt in 24-h |
|||
|---|---|---|---|
| OBS | |||
| Yes | No | ||
| FCST | Yes | 262 | 1588 |
| No | 389 | 27714 | |
• The distributions of the difference of change in a-deck values in the last 24-h and change in b-deck values in the last 24-h (ABDEL) are examined and for H215 forecasts. The median of the hits (green boxes) are within the observation error (±5).
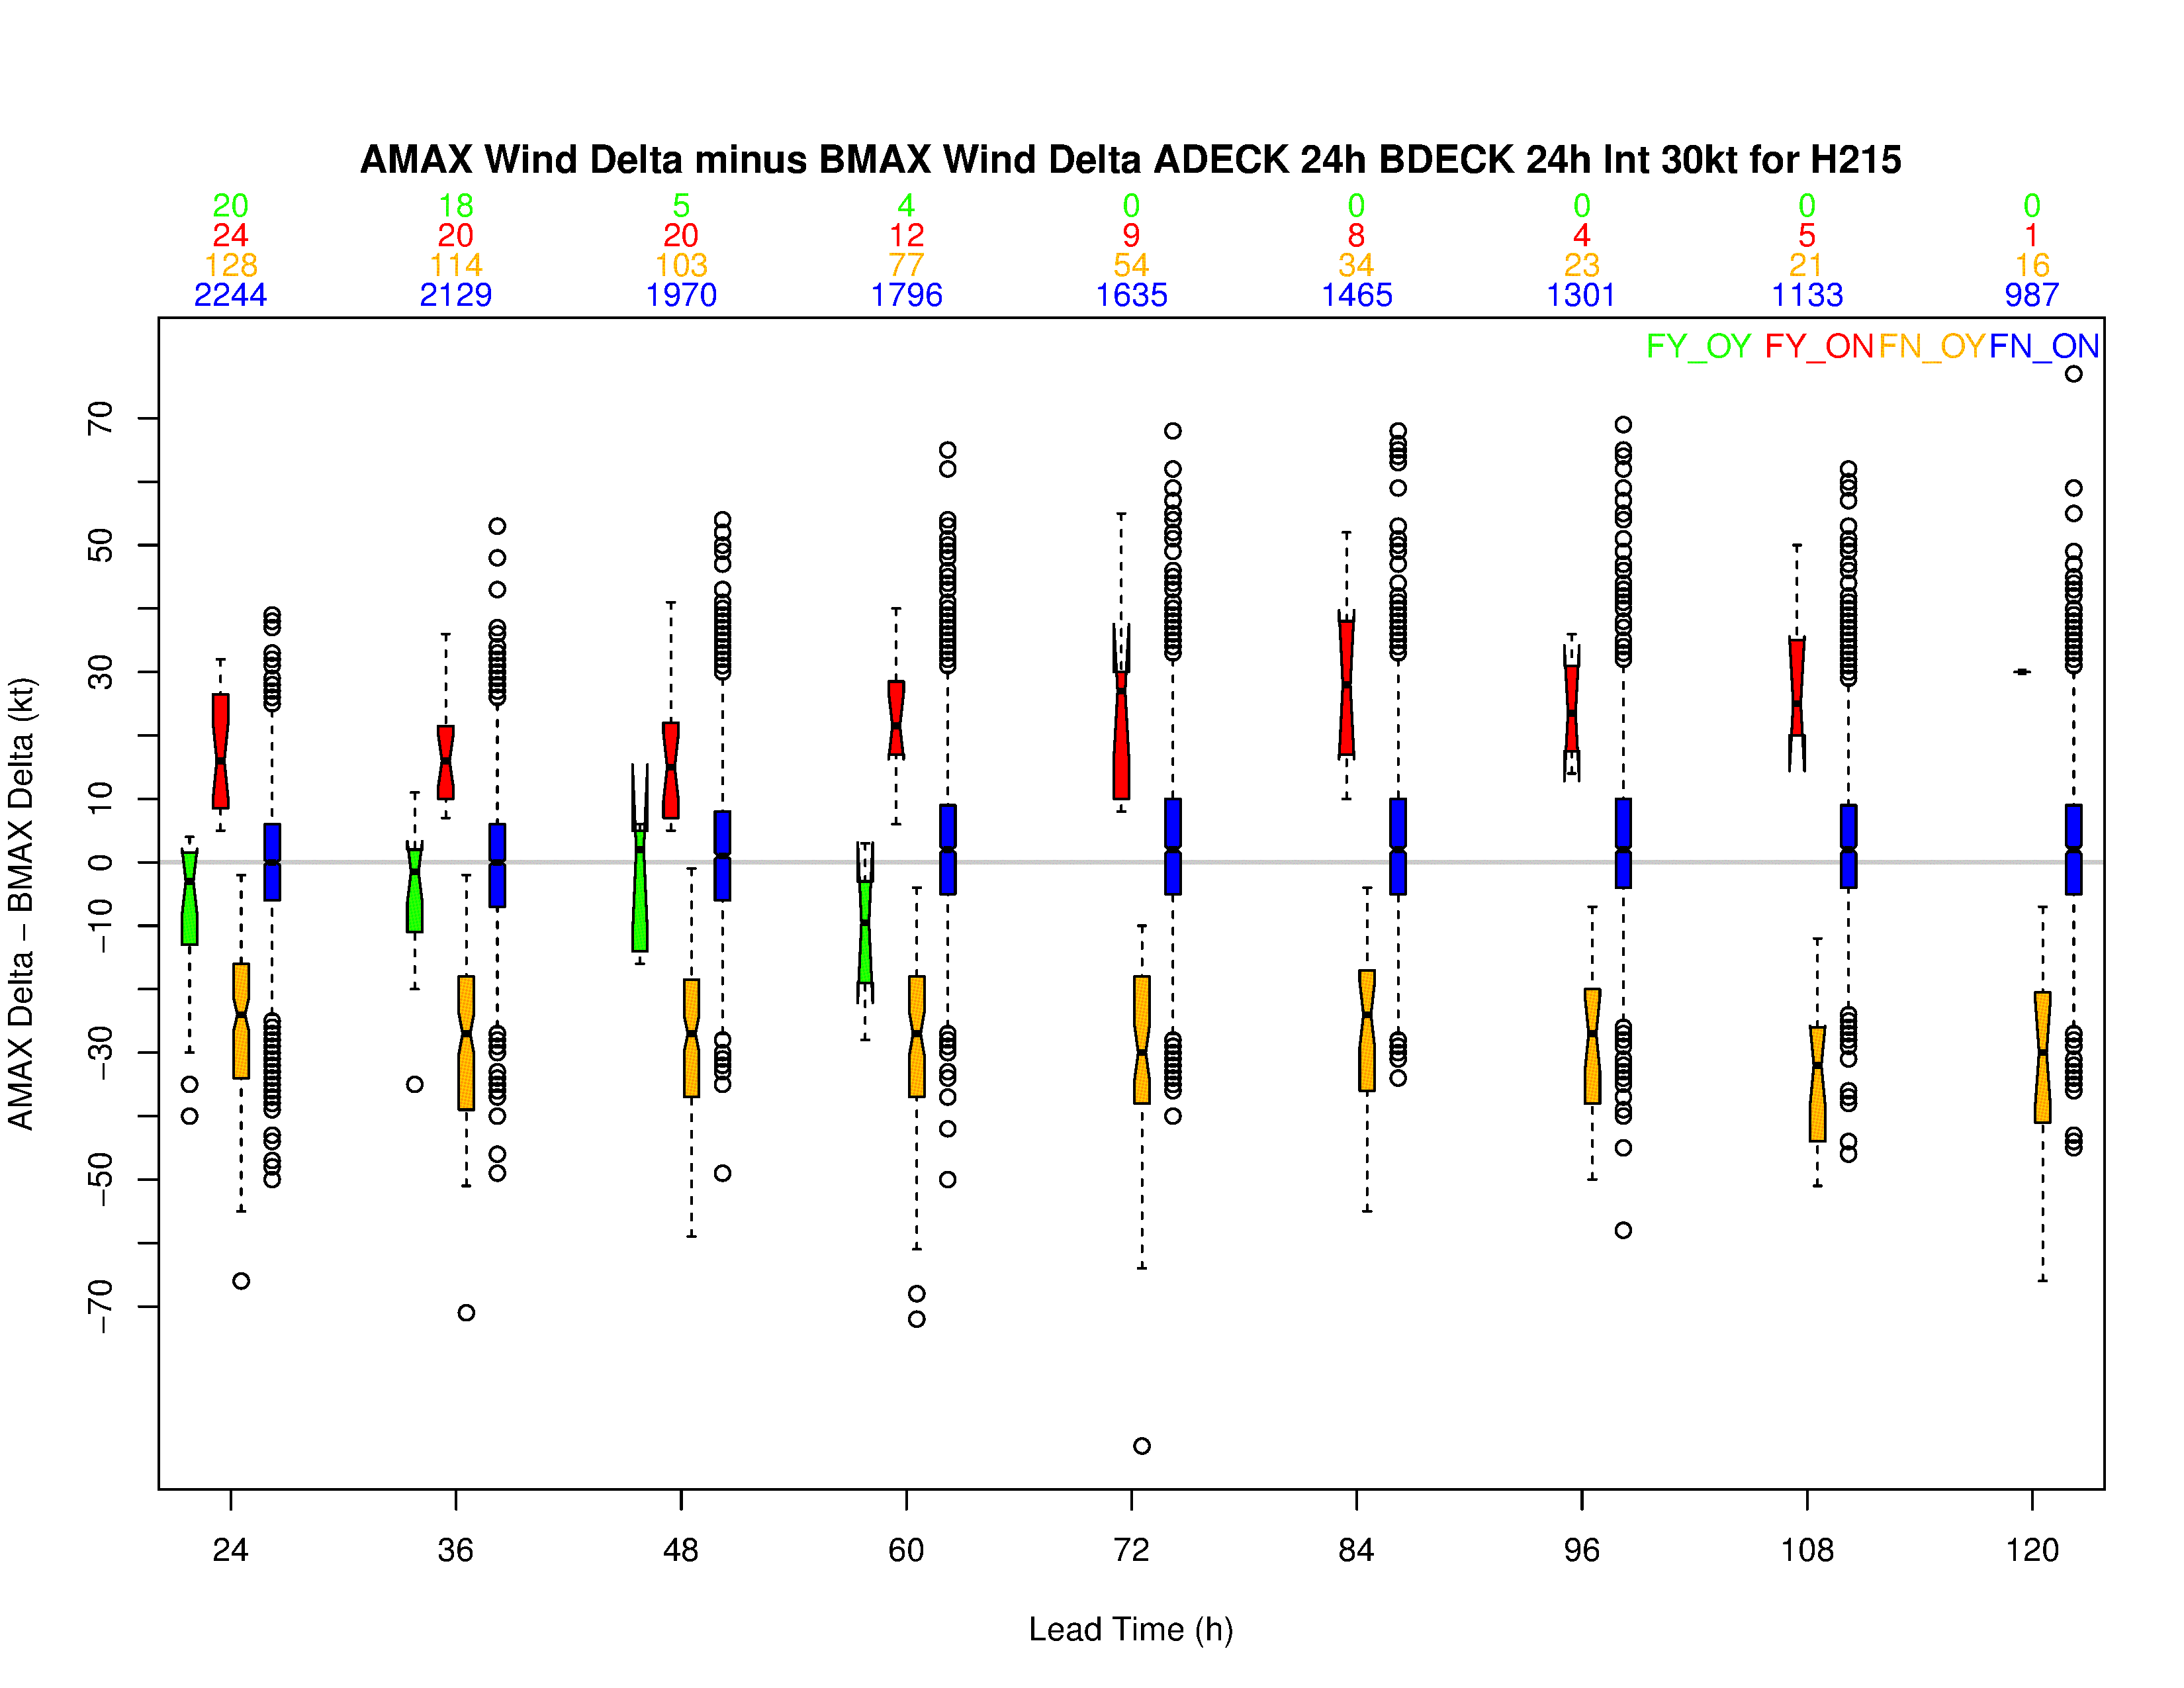
Click for larger image.
• A homogeneous comparison of HWRF-14 and H215 forecasts indicates HWRF-14 and H215 forecast hits (green) are closer to the zero line, indicating that the ABDEL is within the observation error. The false alarms (red boxes) for both the versions indicate that HWRF tends to over-predict the intensity chage by 15-20 kt compared to the observed change. However, when RI events are missed (Orange boxes), the intensity change is underestimated by 20-30 kt.
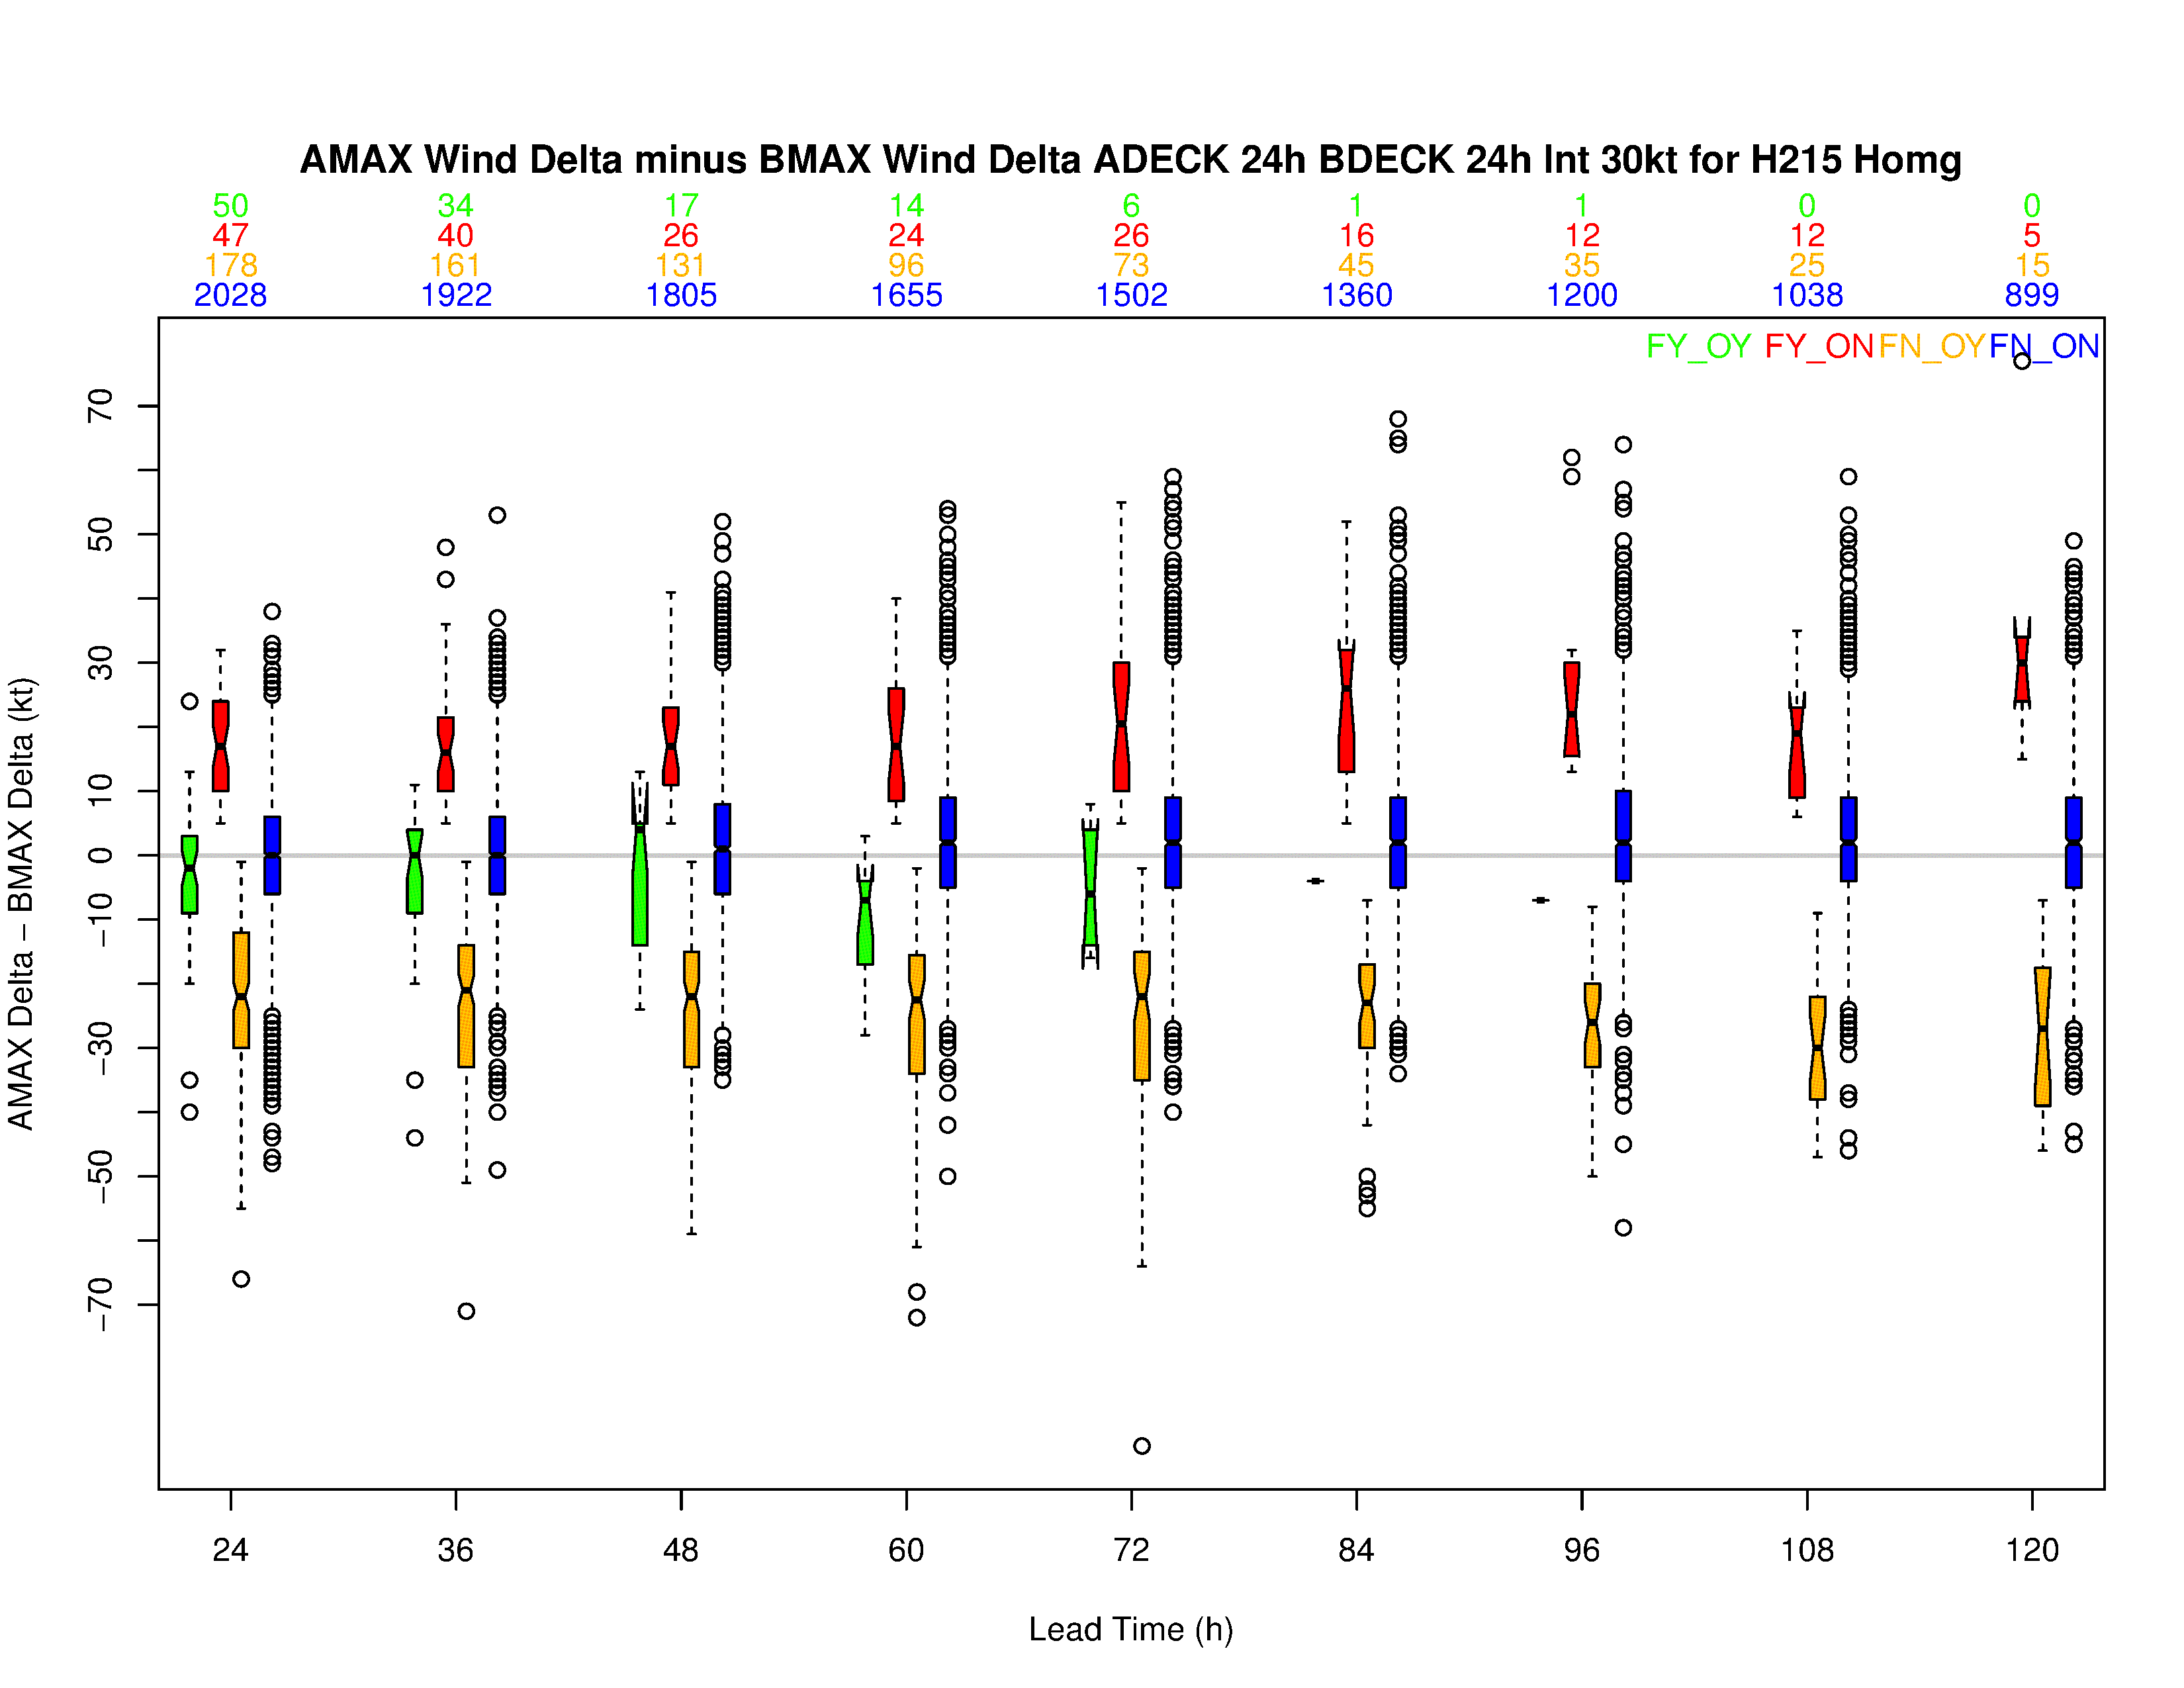
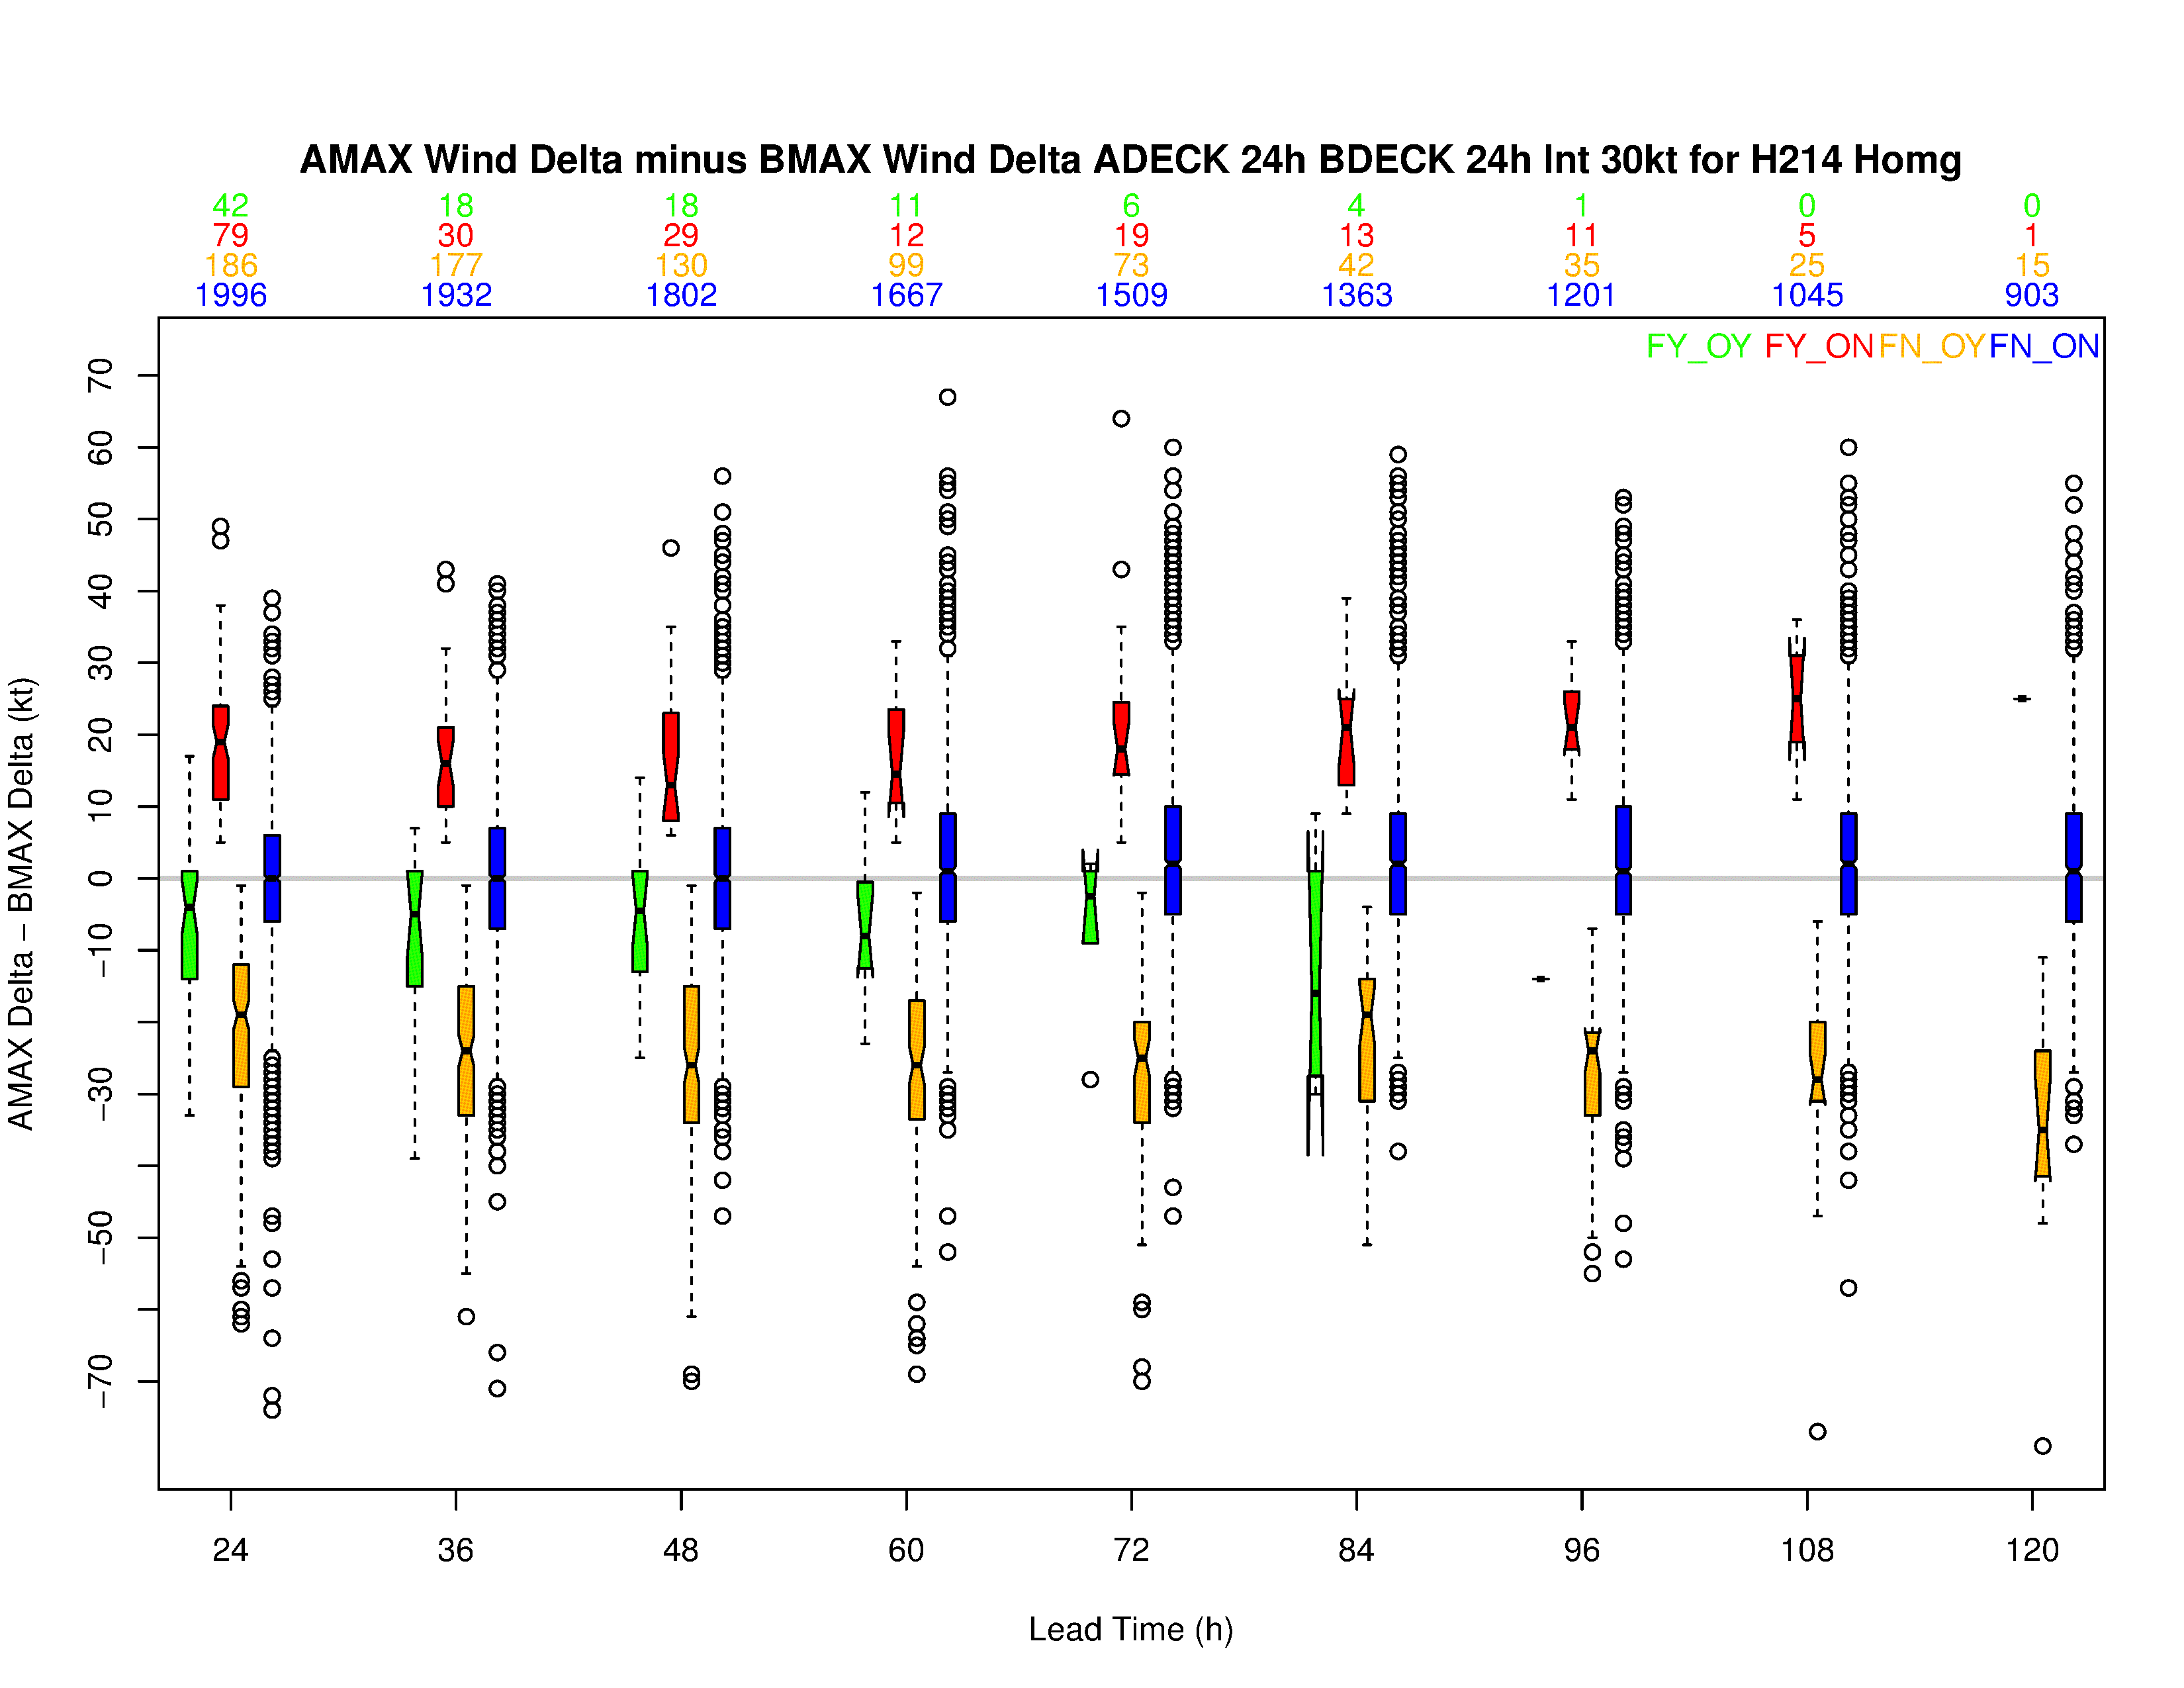
Click for larger image.
• A homogeneous comparsion indicates that the POD (FAR) of RI events for HWRF-14 forecasts are 4% (77%) compared to 7% (70%) for H215. Relaxing the intensity change threshold to 25 kt in 24-h increases the POD of HWRF-14 (H215) to 10% (14%).
H215 RI Contingency tables
H215 30kt in 24-h |
|||
|---|---|---|---|
| OBS | |||
| Yes | No | ||
| FCST | Yes | 72 | 169 |
| No | 973 | 27006 | |
H215 25kt in 24-h |
|||
|---|---|---|---|
| OBS | |||
| Yes | No | ||
| FCST | Yes | 230 | 360 |
| No | 1421 | 26209 | |
H214 RI Contingency tables
H214 30kt in 24-h |
|||
|---|---|---|---|
| OBS | |||
| Yes | No | ||
| FCST | Yes | 42 | 138 |
| No | 1003 | 27037 | |
H214 25kt in 24-h |
|||
|---|---|---|---|
| OBS | |||
| Yes | No | ||
| FCST | Yes | 166 | 341 |
| No | 1485 | 26228 | |